
A Changing Climate
The world of the future will likely not be the world of the past.
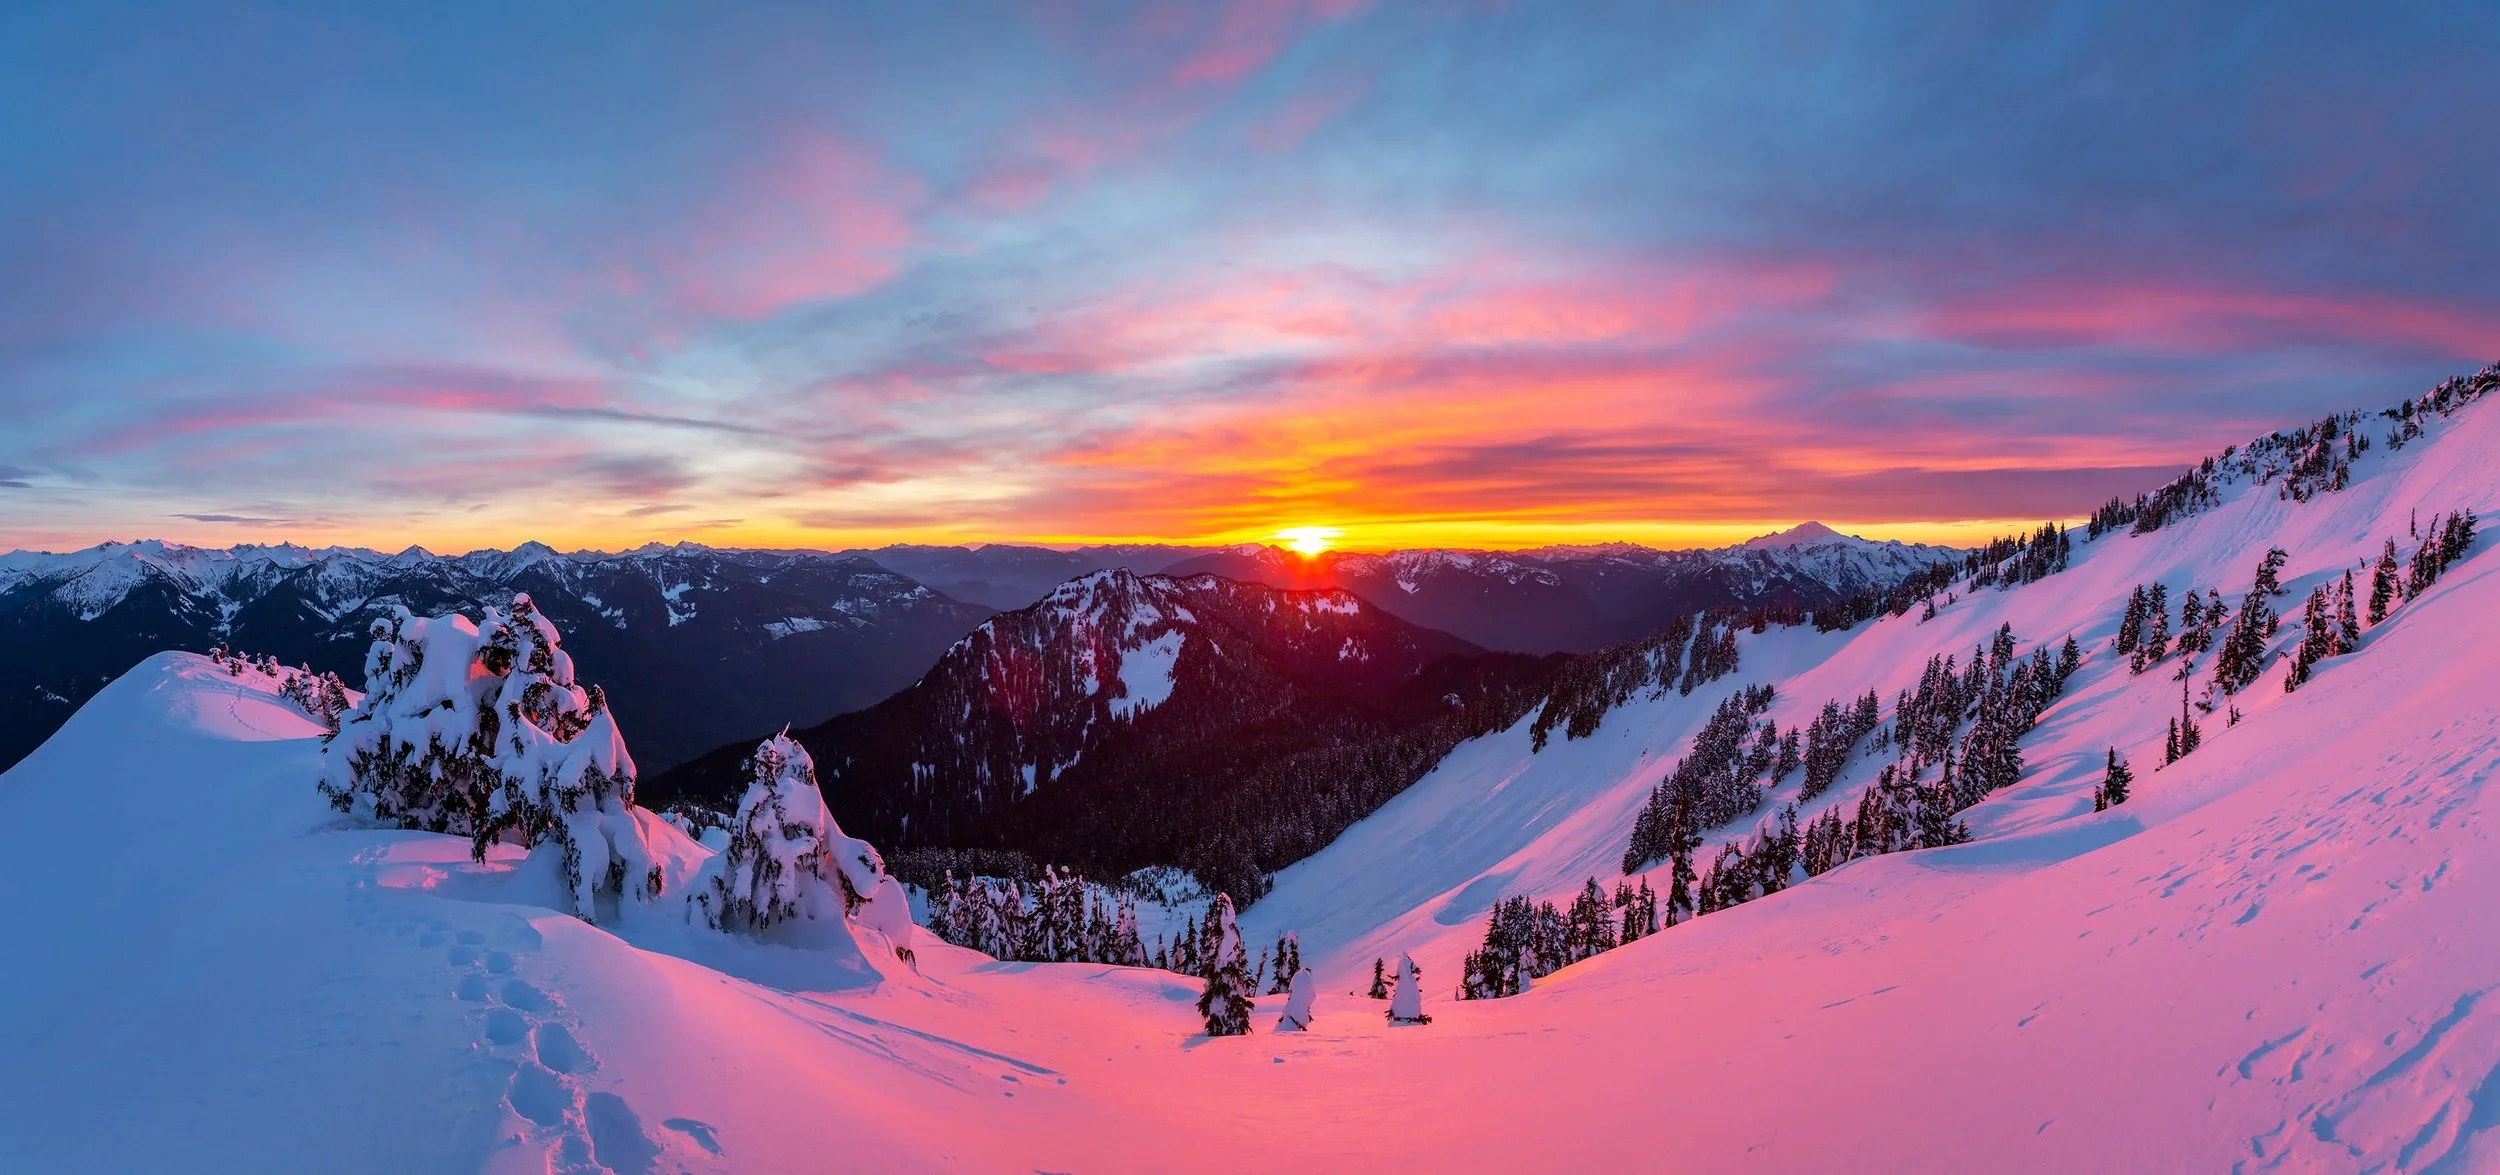
Little Devil Peak at Sunset, North Cascades National Park
© Wyatt Muller
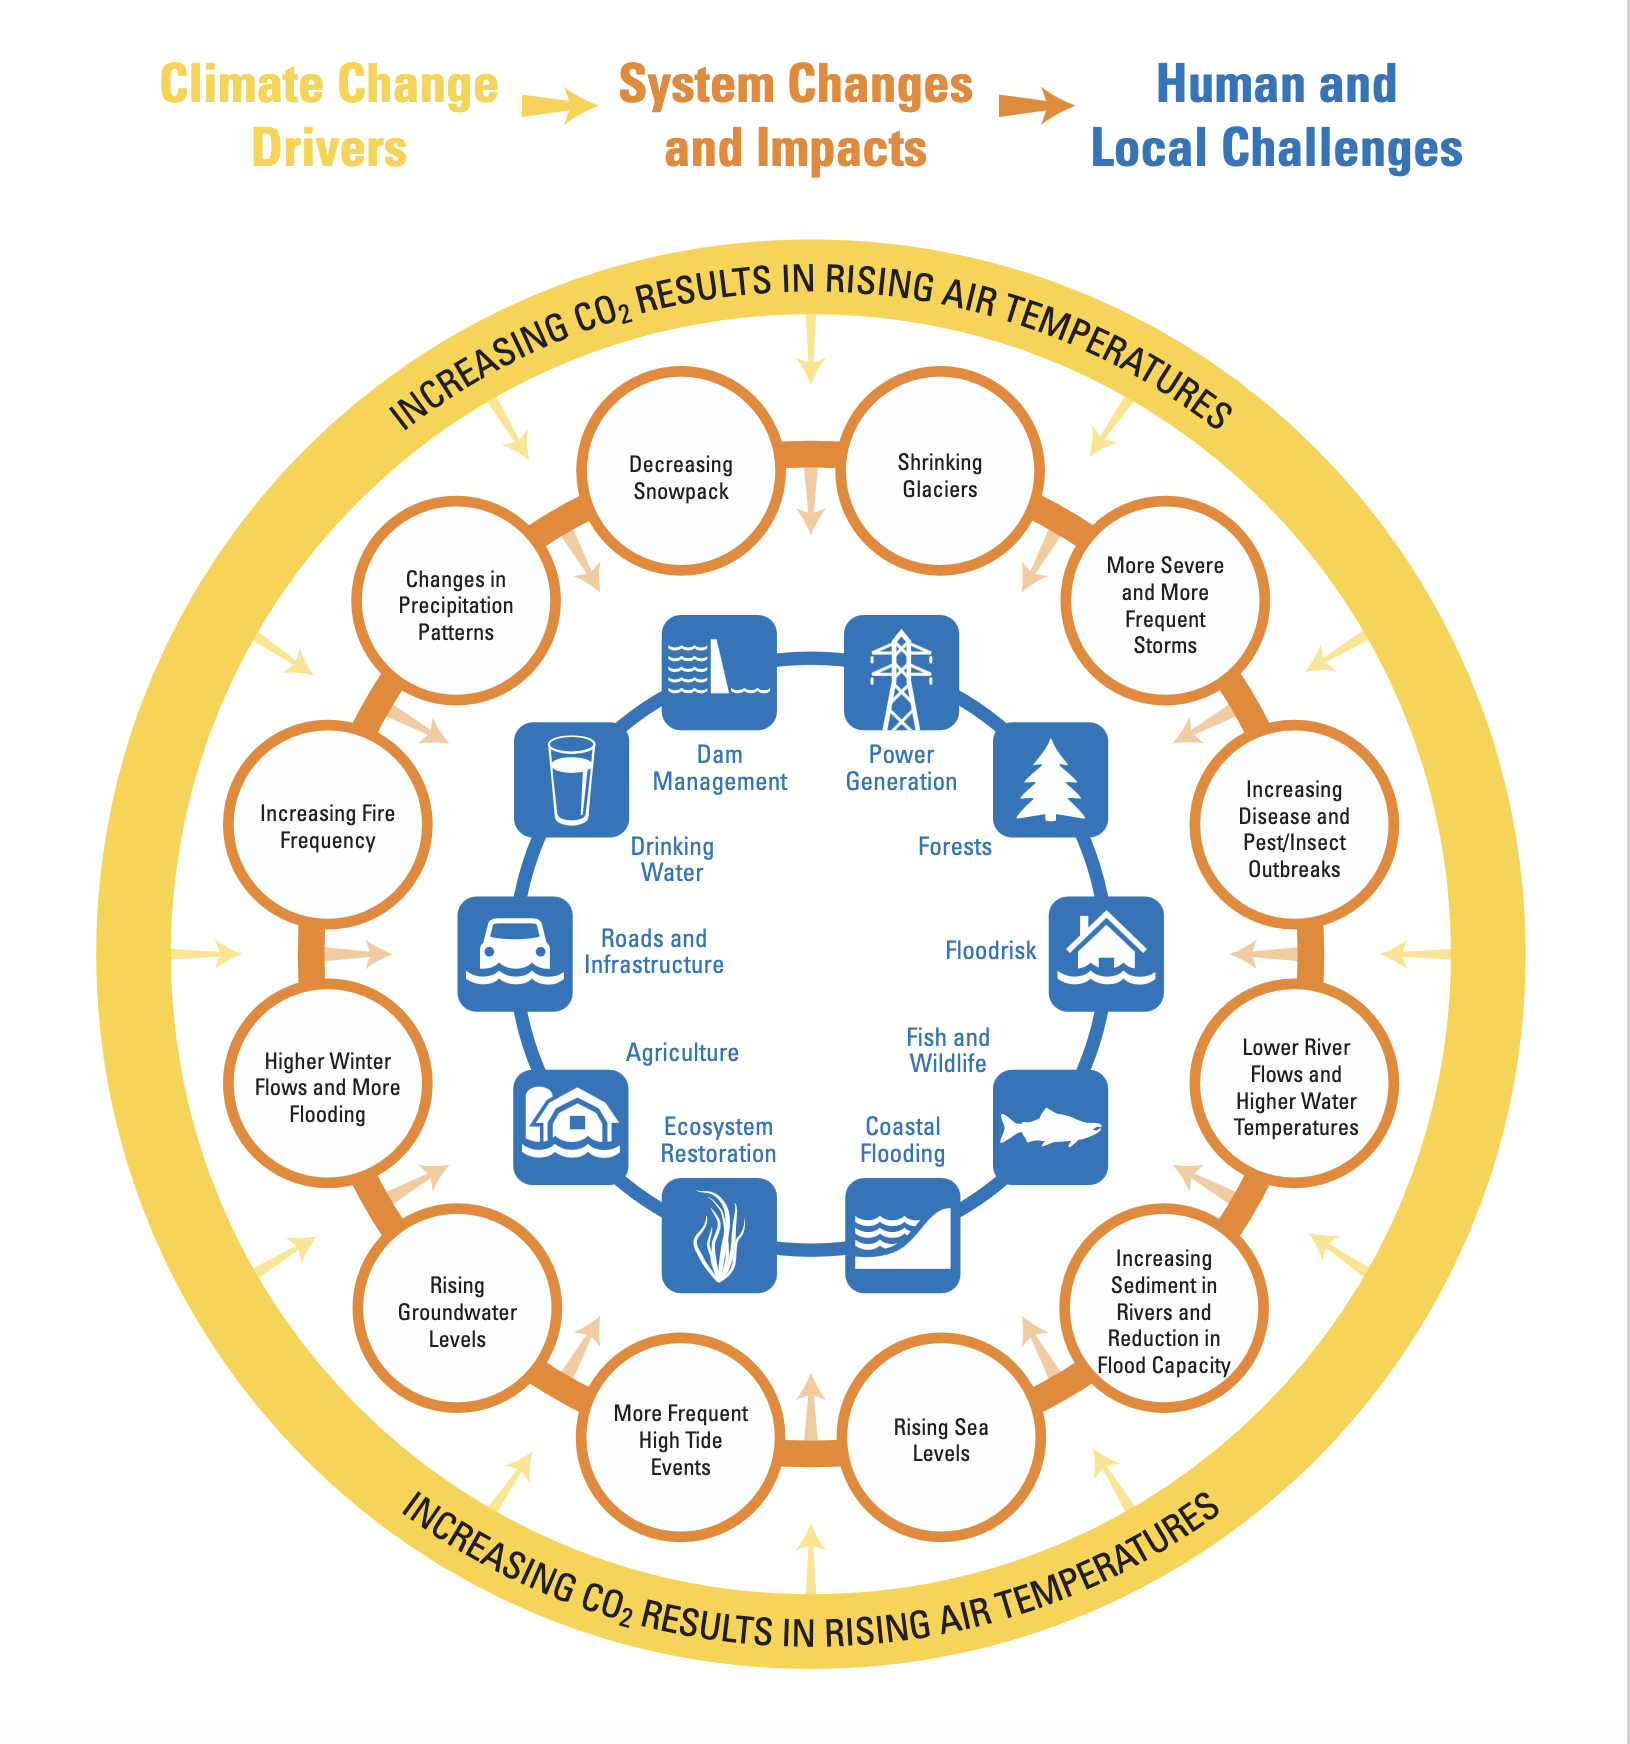
As air temperatures rise globally and locally, over time systems will change in ways that affect people, landscapes and ecosystems.
Understanding and considering future changes can help people best determine if, how and in what time frame they want to adapt.
While our mission at SC² revolves around understanding how a changing climate impacts the Skagit basin, you can explore these climate overview segments to learn more about how climate change is impacting us worldwide:
How do we know the climate is changing?
SC² Collects and Analyzes Data
Scientists, including SC² scientists, collect and analyze data to understand how our world works. Scientists use this data to:
1. Understand physical relationships and calculate mathematical relationships
a. When air temperature increases, snowpack and glacier mass decrease and water temperature increases.
2. Identify trends over time
a. Measurements show a 50 percent decrease in glacier surface area in the Skagit Basin between 1900 and 1998. (Granshaw, 2002)
3. Calibrate, verify and validate models
Climate Models Put Pieces Together Worldwide
Climate models use data and mathematical relationships to project future trends. Figure 1 shows some of the physical Earth systems and interactions that are incorporated into climate models. Scientists create computer models of the global climate system (Figure 2). To “run” a model, scientists divide the planet into a three-dimensional grid, apply differential equations to calculate physical properties (wind, heat transfer, etc.) within each grid cell and the interactions
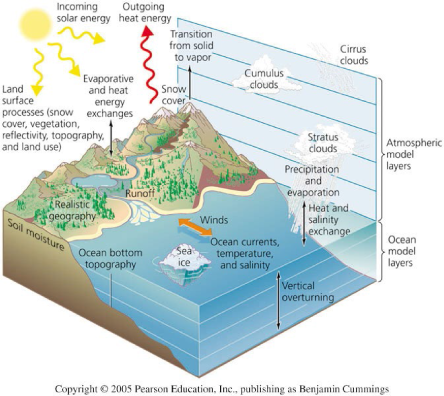
Figure 1. Major processes affecting the global climate system
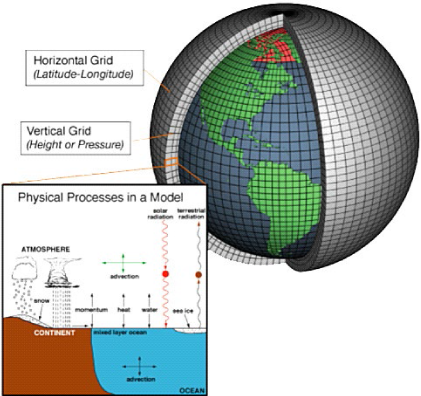
Figure 2. Schematic of global climate system computer models Source: http://celebrating200years.noaa.gov/breakthroughs/climate_model/welcome.html
Climate Models Put Pieces Together Locally
Information from global climate models can be increased in resolution to project more specific, local changes and conditions (Figure 3).
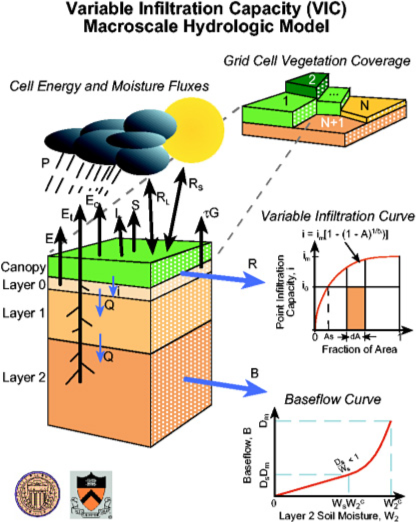
Figure 3. An example of a hydrologic model that translates global and regional climate data to inform how the Skagit River will likely respond.
What Does the Future Hold?
Climate models are not magic boxes that predict the future, but tools that illustrate a range of possible scenarios. Policymakers, stakeholders and citizens use model projections to guide decisions. Scientists have been refining and improving climate models for decades. These models consistently support the conclusion that humans are contributing to the increase in global temperatures: natural climate factors alone cannot explain the rapid rise in temperature at the end of the 20th century (Figure 4). These results also highlight the importance of incorporating both human and natural inputs in future climate projections.
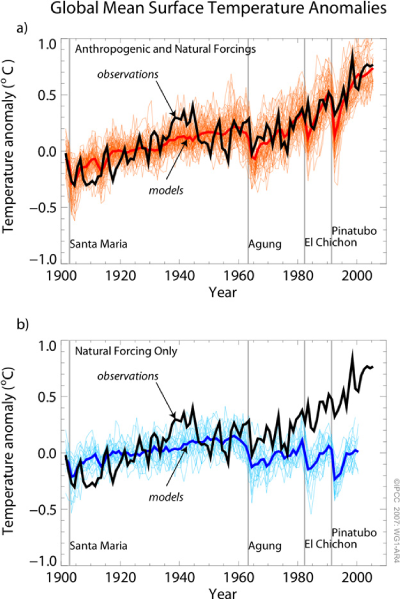
Figure 4. Red graph: Model results relative to observed data, including natural and human (“anthropogenic”) climate impacts (“forcings”). Blue graph: Model results including only natural impacts on climate, like volcanic eruptions. The output from 20 different climate models was averaged into this representation. Source: Intergovernmental Panel on Climate Change, 2007
Weather vs Climate
The Skagit Valley’s environment, economy, and communities have been shaped over time by weather and climate.
Weather: What We Get
Weather is a snapshot of conditions in the near-term, such as the amount of cloudiness or sunshine, temperature, and wind direction at a specific location and point in time (typically minutes to days or even weeks). Weather happens on any given day, month or season.
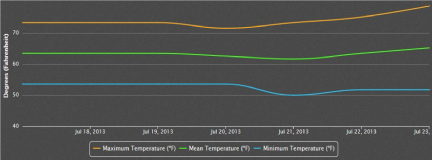
Figure 5. Observed daily maximum, minimum, and mean temperature at Skagit Regional Airport from July 18–22, 2013. Source: weathersource.com
Climate: What We Expect
Climate, on the other hand, is the average of weather conditions over longer time periods, raging from months and years to decades, centuries, or longer. For example, while the weather forecast for Mt. Vernon on August 30 was a high of 69°F, the average high for that day (the climate “normal” based on 30 years of record) is 73°F.Climate happens over time.
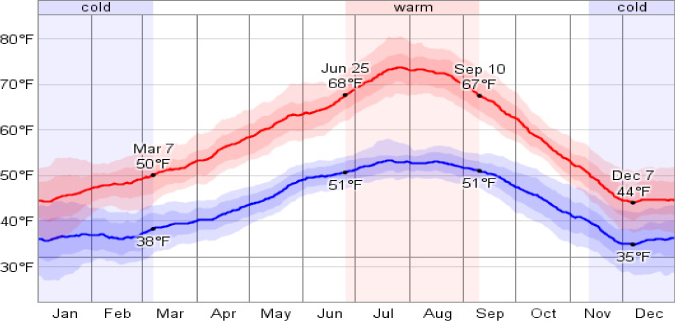
Figure 6. The average minimum and maximum temperatures for Mt. Vernon from 2003–2012. The bands of color denote the normal range of variability. Source: weatherspark.com/averages/29830/Burlington-Mount-Vernon-Washington-United-States
In any given season, year, or decade, sustained natural variations in ocean temperatures, winds, and other factors will cause climate to deviate from average for that time period.
Unlike natural climate variability, climate change is recognized as having a direct association with human activities that emit heat-trapping gases such as carbon dioxide, methane, and nitrous oxide into the atmosphere. Since the start of the Industrial Revolution around 1750, the concentration of carbon dioxide, methane, and nitrous oxide has increased 35%, 142%, and 18%, respectively. Long-term natural climate archives like ice cores have shown us that these changes are enormous by geologic standards.
For example, analysis of Antarctic ice cores has helped scientists determine that the current concentrations of carbon dioxide and methane in the atmosphere “by far” exceed the natural range of these gases over the last 650,000 years. And as greenhouse gases have increased, global temperature has increased. Between 1906 and 2006, average annual global temperature increased 1.3°F (IPCC 2007); warming since the 1950s is “very likely” due to human-caused increases in greenhouse gases, meaning there is more than a 90% chance that human activities played a significant role in the observed warming during that time.
Climate variability and climate change are occurring simultaneously, but operating under different timescales. This distinction is important when thinking about how we will experience climate change and climate impacts. Natural variability will continue to affect Pacific Northwest climate on annual to decadal time periods even as climate change increases the average temperatures around which climate varies over longer timeframes (decades to centuries). This means, for example, that we will continue to see colder than average years (such as the La Niña winter and spring of 2010–2011) and warmer than average years in the coming decades even as long term global and regional temperature trends increase.
Another example is the winter and spring of 2011, which saw precipitation in the North Cascades at 123% above average (1970–1999) and exceptionally high snowpack throughout the Cascades late into the spring, was a La Niña and a cold phase Pacific Decadal Oscillation year. Neutral phases of both cycles are characterized by average winter conditions.
A fuller description of these natural variations can be found here.
Between 1906 and 2006, average annual global temperature increased 1.3°F
Source: IPCC 2007
Natural Variability & Climate Change
In any time period (seasons to decades), natural variations in ocean temperatures, winds, and other factors can cause the climate to deviate from what is considered typical.
Two Important Phenomena
Two important phenomena affecting the Pacific Northwest—the El Niño Southern Oscillation (ENSO) and the Pacific Decadal Oscillation (PDO)—are caused by naturally changing patterns in ocean circulation (Figure 7). These natural phenomena create cyclical patterns of climate variability. ENSO has a warm phase (El Niño) and cold phase (La Niña), and lasts 6 to 18 months. PDO is similar, but phases last 20 to 30 years (Figure 8).
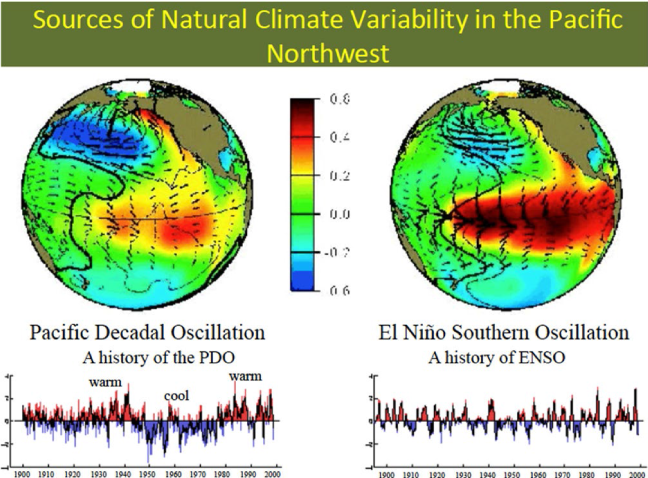
Figure 7. Sea surface temperatures patterns for warm phase PDO (left) and ENSO (right), with a time series showing periods of warmer (red) and cooler (blue) phases over the 20th century. Source: Climate Impacts Group, University of Washington.
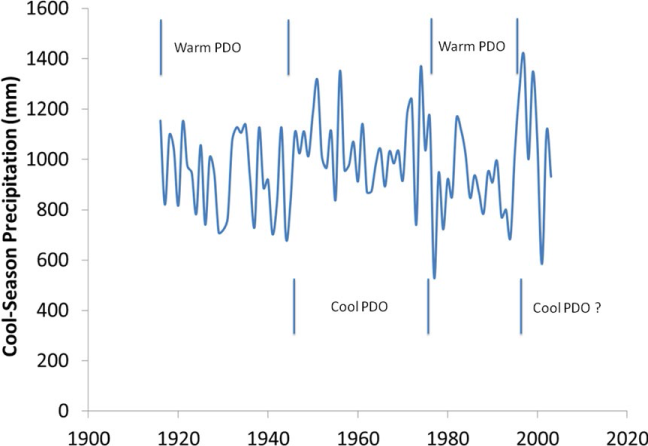
Figure 8. Cool-Season (Oct-March) precipitation averaged over the WA and OR Cascades with “warm” and “cool” PDO epochs. Warm phases mean warmer, drier winters; and cool phases mean cooler, wetter winters with above average snowpack and streamflow.
Complex Combination
The overall consensus among climate scientists worldwide is that the Earth’s climate has changed substantially over the last century and will continue to change in the coming decades as a result of increasing emissions of heat-trapping gases from human activities. These “greenhouse gases” include carbon dioxide, methane, and nitrous oxide, and as their concentrations increase in the atmosphere, global temperatures rise.
Climate change will express itself as a complex combination of variability plus a trend. The cyclical pattern of natural variability (blue line in Figure 9) is combined with an overall warming trend (red line). What results is a “stairstep” pattern (black line) of rapid rise and plateau. This means, even as global and regional temperature trends increase over time, there will still be colder than average periods and warmer than average periods as natural variability and climate change occur simultaneously.
For example, from 1959–2011 north Cascades glaciers have had periods of rapid decline as temperatures warm and periods of plateau in cooler years (Figure 10).
Another example is the winter and spring of 2011, which saw precipitation in the North Cascades at 124% above average (1970–1999) and exceptionally high snowpack throughout the Cascades late into the spring, was a La Niña and a cold phase Pacific Decadal Oscillation year. Neutral phases of both cycles are characterized by average winter conditions.
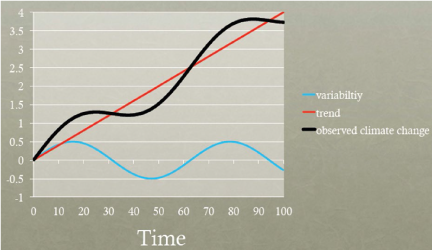
Figure 9. Climate change variability
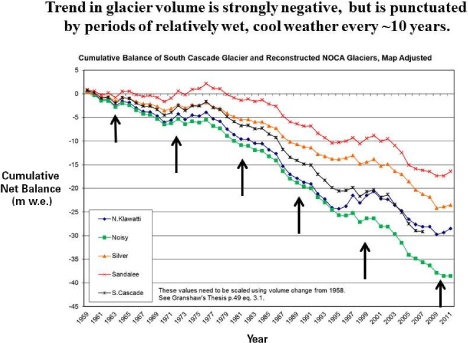
Figure 10. Cumulative changes in mass for five north Cascades glaciers from 1959–2011. Sources: Granshow, 2001; Riedel and Larrabee
As global and regional temperature trends increase over time, there will still be colder than average periods and warmer than average periods as natural variability and climate change occur simultaneously.
Climate History
Reconstructing the Past to Inform the Future
Probing the History of Climate Change
Instrumental measurements are useful to study recent climate change, but there are few records before 1850. To understand climate change over a longer timescale, scientists study physical evidence that is recorded in nature. Tree-rings, glacial ice cores, corals, stalactites, geoducks, lake and sea floor sediment cores, and forests buried by glaciers provide physical evidence of historical environmental conditions. These “proxy” records are used to reconstruct past climate conditions. Local proxies that have been recovered from Skagit basin include lake cores and glacially buried forests.
Climate Change in the Past 2,000 Years
Multiple temperature reconstructions have been created using a variety of physical climate proxies. Temperature reconstructions (Figure 11) demonstrate temperatures in the Northern Hemisphere today are warmer than they’ve been for at least 2,000 years.
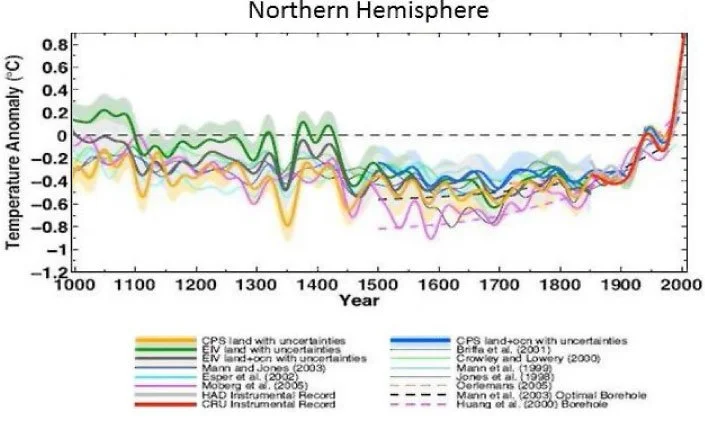
Figure 11. Instrumental measurements, available since the 1850s, generally agree with the temperature reconstructions where they overlap (shown in the red line at the edge). Source: Mann and others, 2008
“The farther back you can look, the farther forward you are likely to see.”