
Air Temperature & Precipitation
Temperatures for the Pacific Northwest demonstrate a clear upward trend in the regional projections. Scientists expect that the quantity of precipitation that the Pacific Northwest receives will remain constant, while seasonal distribution of precipitation and quantity in storm events are predicted to change.
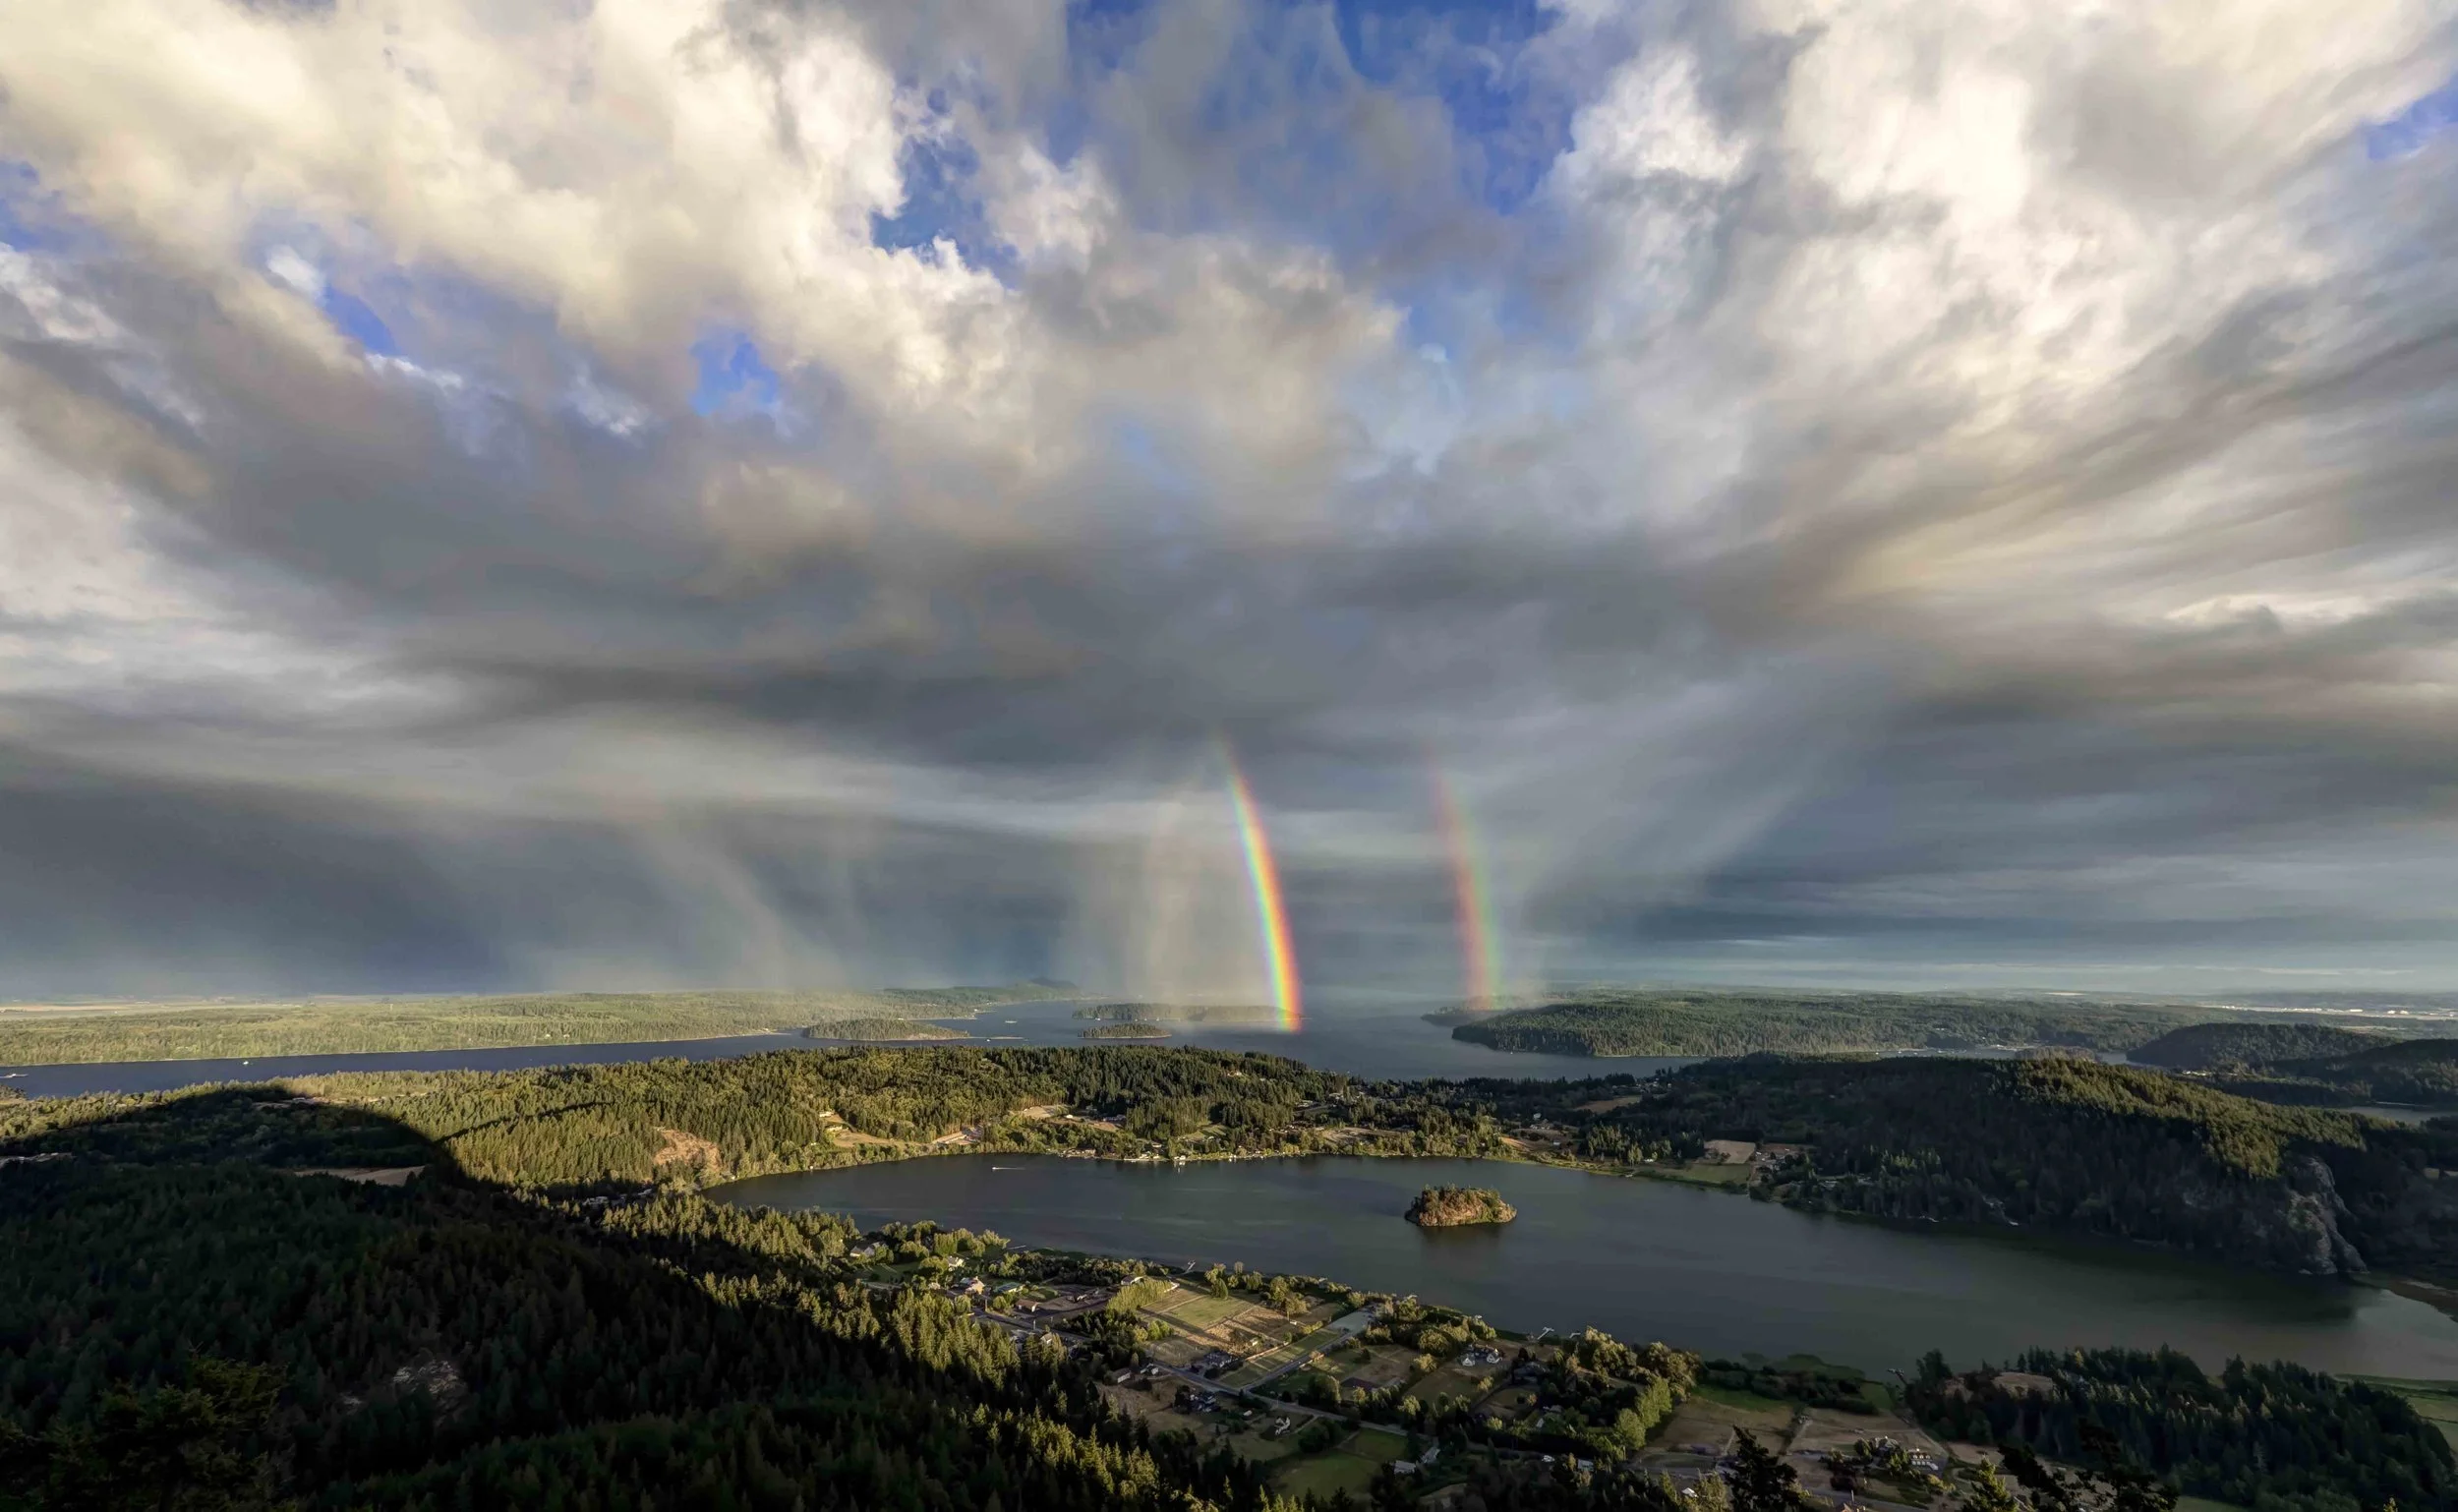
Rainbows After a Storm, Anacortes
© Andy Porter
The Earth Is Warmer
Significant warming has been observed in most locations worldwide.
Red and purple colors on Figure 1 indicate warming, while blue colors indicate cooling. White represents insufficient data to permit a robust trend estimate. The + signs indicate statistically significant trends.
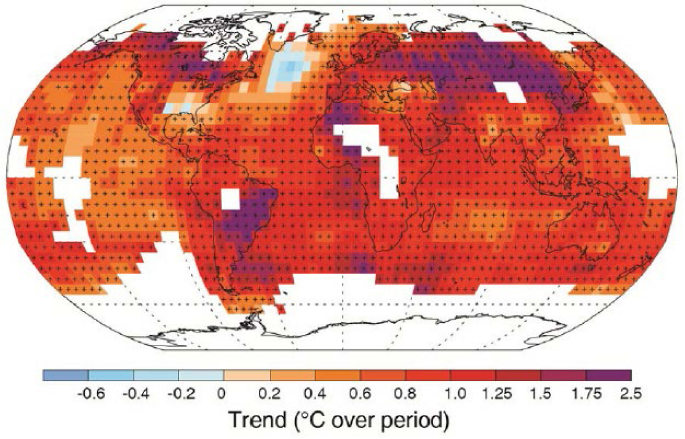
Figure 1. Observed Change in Temperature, 1901–2012. Source: figure and caption adapted from Intergovernmental Panel on Climate Change (IPCC) Report 2013 (Figure SMI.b.)
The Pacific Northwest Is Warmer
Temperatures are rising in the Pacific Northwest.
Figure 2 displays the average annual temperature (red line) relative to the 1901–1960 average (solid horizontal line). The dashed line is the fitted temperature trend, which indicates +0.13°F/decade of warming for 1895–2011.
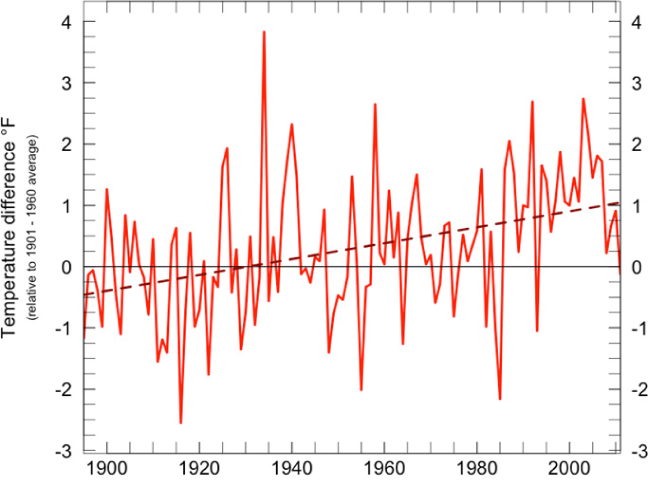
Figure 2. Source: Kunkel et al. 2013
Figure 3 shows the projected increases in annual temperature exceed the highest temperatures in the 20th century attributable to natural variability. This means that by the mid-21st century, annual temperatures in the coolest years (5th percentile) will exceed the very hottest years (95th percentile) for the mid-20th century.
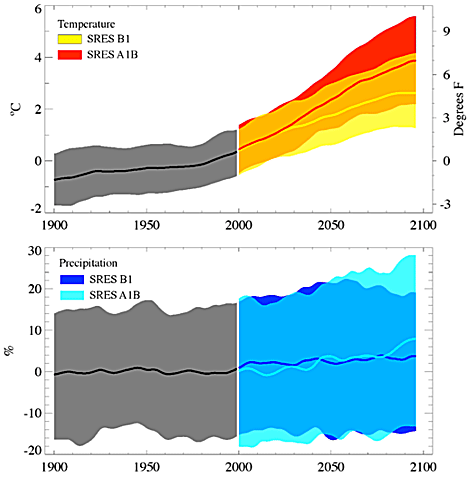
Figure 3. Source: Mote and Salathé, 2010
Skagit County Is Warmer
Annual mean temperatures throughout the Skagit basin are on the rise. Winter mean temperatures show a more pronounced increase.
Warming at Low Elevation Sites: 0.2°F per decade at low elevation sites, an increase of 2°F in 100 years.
Warming at High Elevation Sites: 1.1°F per decade at high elevation sites, an increase of 5.5°F in 50 years. Records at high elevation sites are short and incomplete in early years of measurement, limiting our confidence in this trend.
In 2017, SC2 members assessed historical climate trends of interest to Seattle City Light for their reservoir management. For more information on trends, click here.
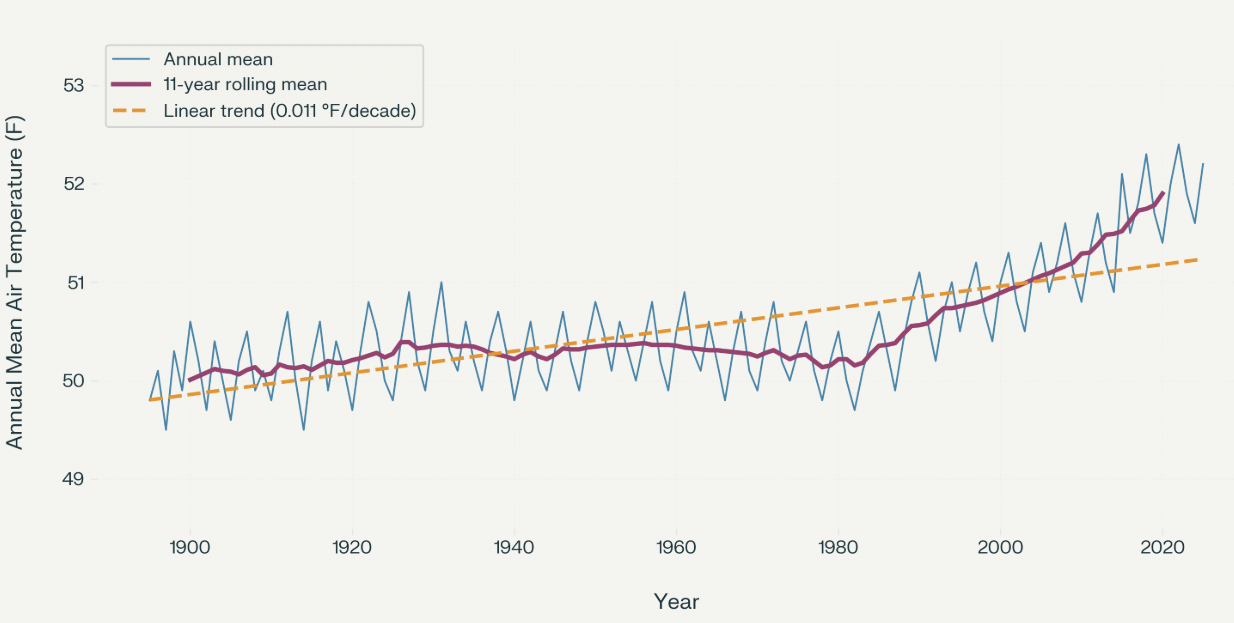
Figure 4. Mount Vernon Temperature Records 1900 to 2020
Models Project Rapid Warming
Global average temperatures are projected to increase 4.7 to 8.6° F by 2100 if the current path of greenhouse emissions continues.
Average temperatures for the Pacific Northwest are projected to increase 2 to 8.5° F by 2050.
Skagit-specific future temperatures have not been modeled.
Source: Snover, A.K, et al, 2013. Climate ChangeImpacts and Adaptation in Washington State:Technical Summaries for Decision Makers.
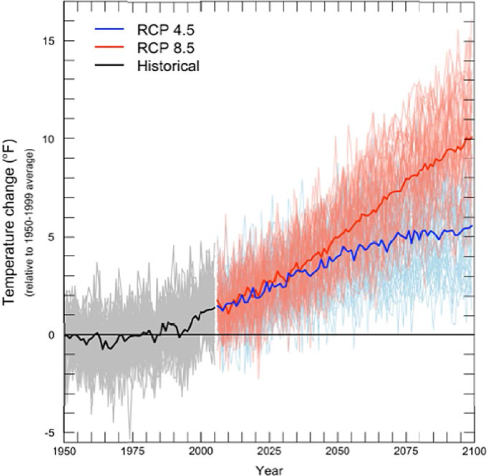
Figure 5. Average yearly temperatures for the Pacific Northwest projected for the 21st century given four emissions scenarios (RCP –Representative Concentration Pathways), relative to the average for 1950–1999 (gray horizontal line). Source: Climate Impacts Group, based on climate projections used in the IPCC 2013 report.
Precipitation
Future projections of mean annual rainfall (average number of inches of rain during a given year) for the Pacific Northwest do not differ significantly from 20th century observations; and the projections of mean annual precipitation are within the limits of past variability.
However, an analysis that breaks the projections into seasonal categories, reveals a clear seasonal trend in precipitation: drier summers and wetter springs, winters and autumns compared to 20th century averages (Mote and Salathé 2010). Also, as warming temperatures and precipitation interact, snow elevations will rise changing the amount of precipitation that falls as rain instead of snow.
For the Skagit Basin, precipitation projections indicate increases of 9.8% in the winter, 8.0% in the spring and 19.2% in the fall, but a 27.6% decrease in the summer by the 2080s compared to the late 20th century seasonal averages (ENVISION report by Lee et al. 2011).
How does a warming climate affect flood risk?
For the Skagit Basin, precipitation projections indicate increases of 9.8% in the winter, 8.0% in the spring and 19.2% in the fall, but a 27.6% decrease in the summer by the 2080s compared to the late 20th century seasonal averages.
Source: ENVISION report by Lee et al. 2011