
Flood Risk: Rivers
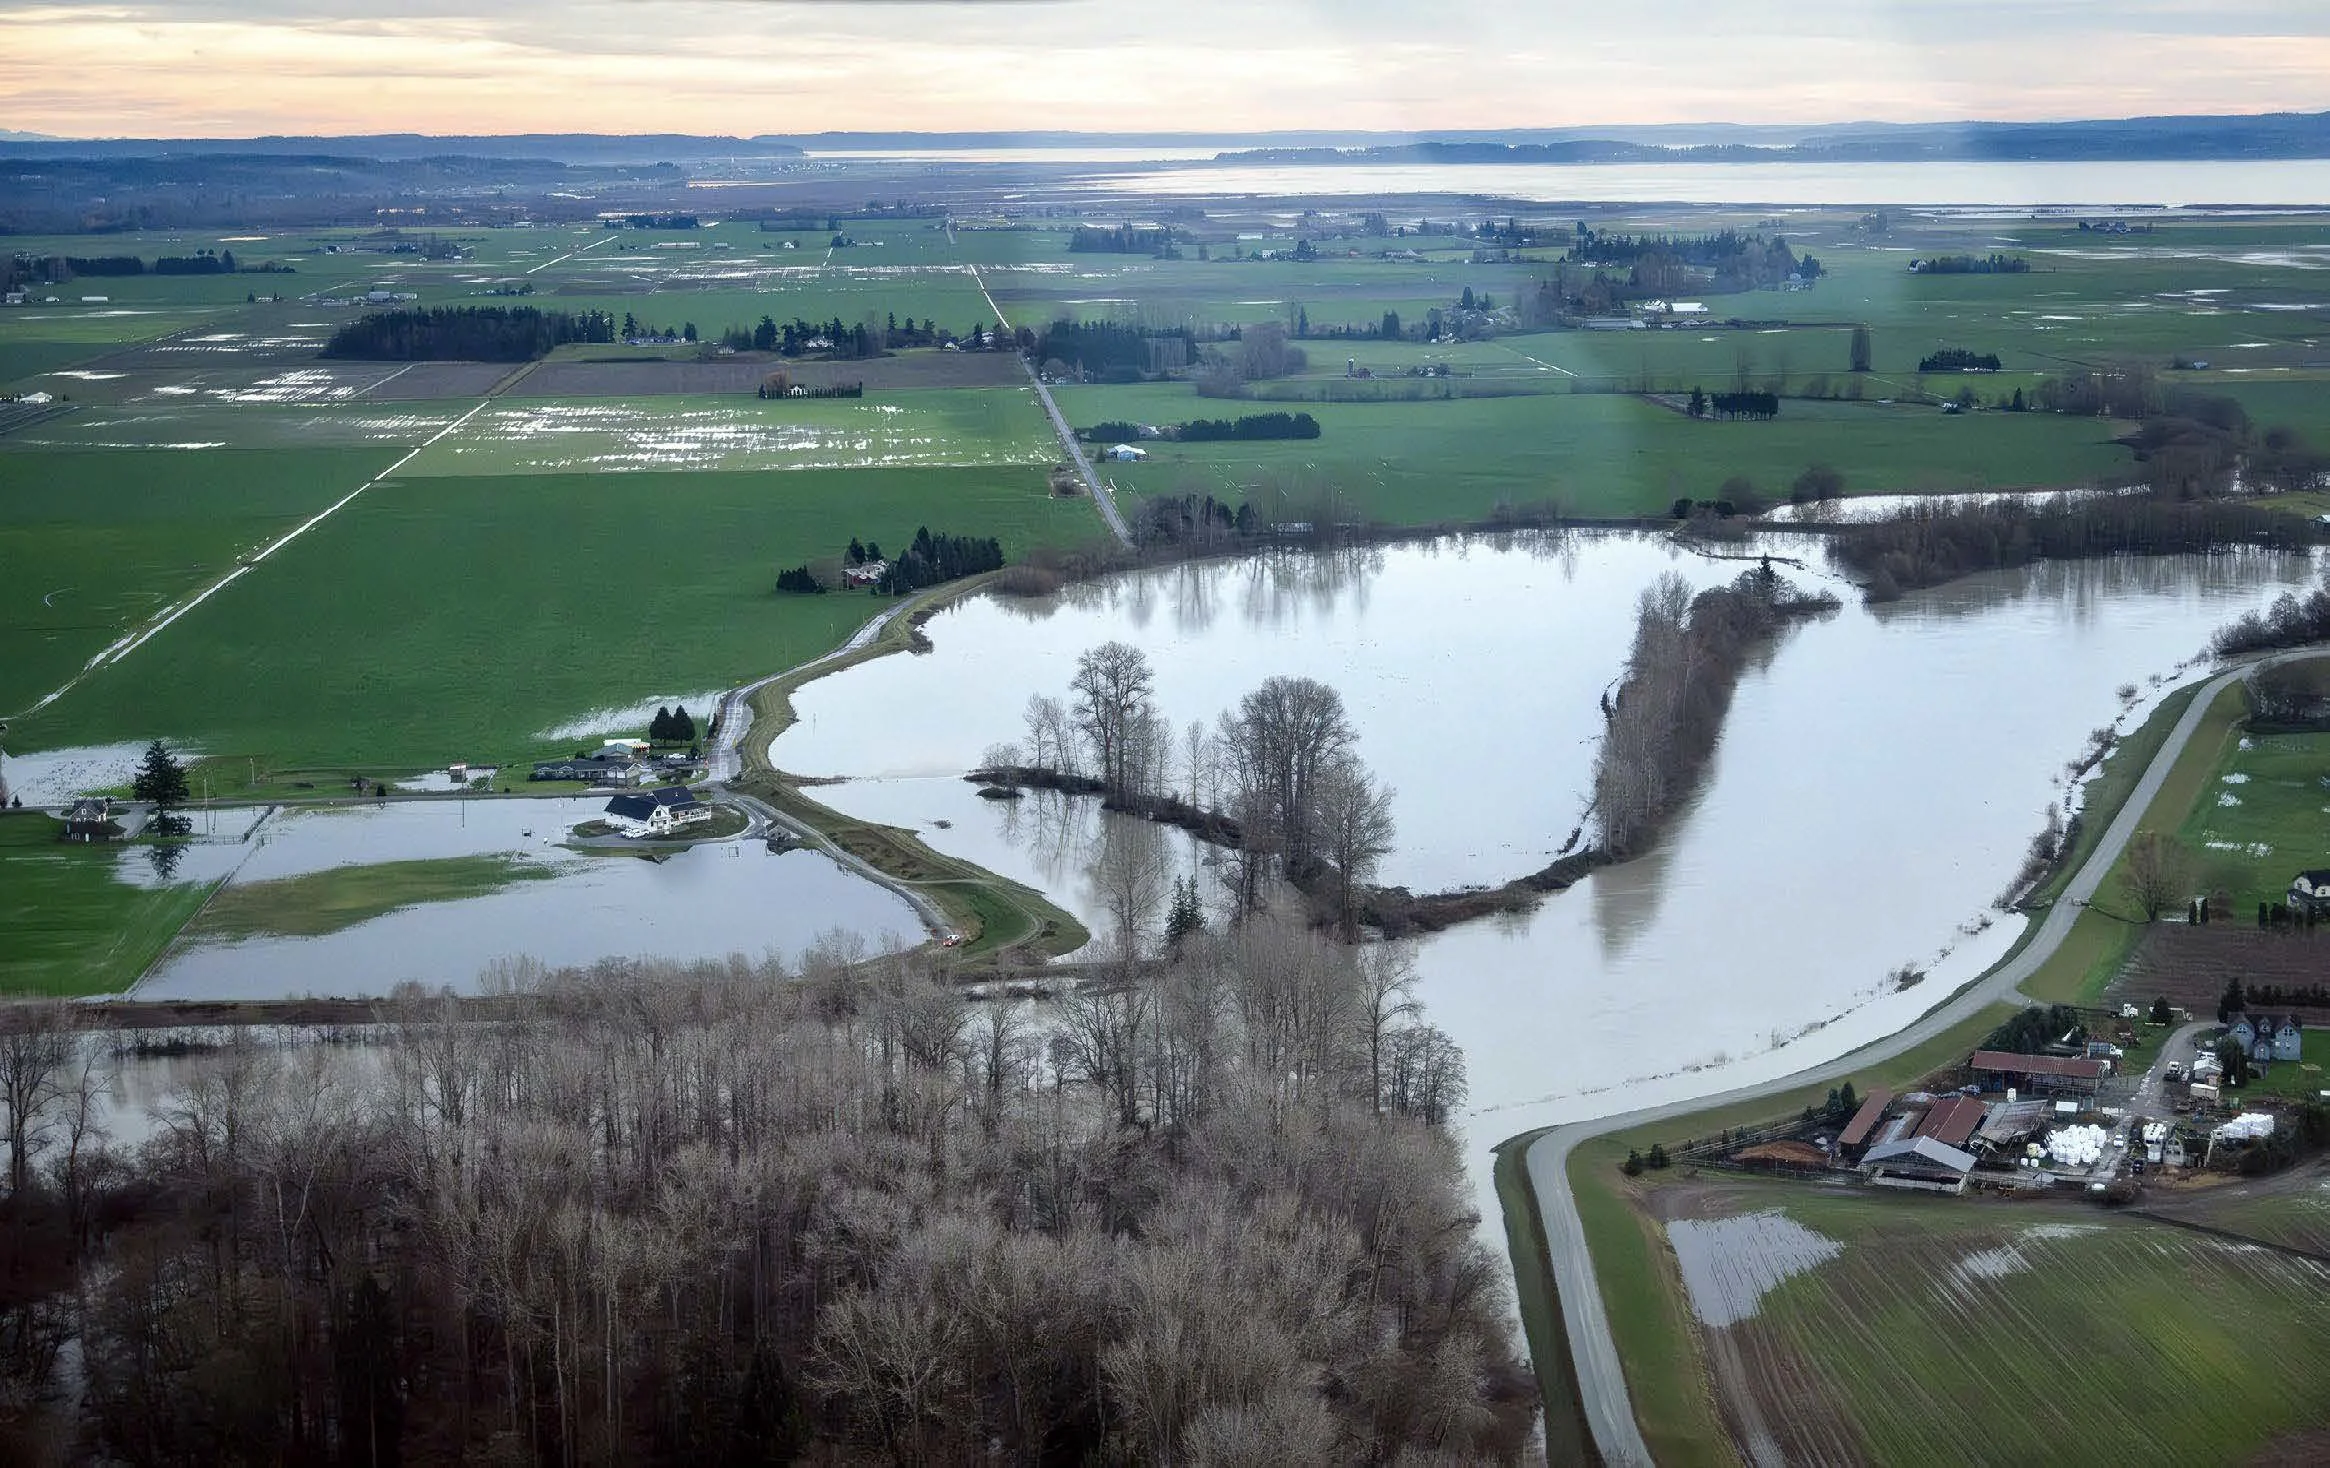
Dry Slough, Fir Island
© Eric Mickelson
The Skagit Watershed
The Skagit is the largest river draining into Puget Sound, extending into Canada and encompassing much of the high-elevation North Cascades, from Mount Baker to the Cascade Crest. In the lower reaches of the river, the floodplain extends from the South Fork Skagit River near Stanwood to Samish Bay to the north, encompassing the largest delta area in Puget Sound.
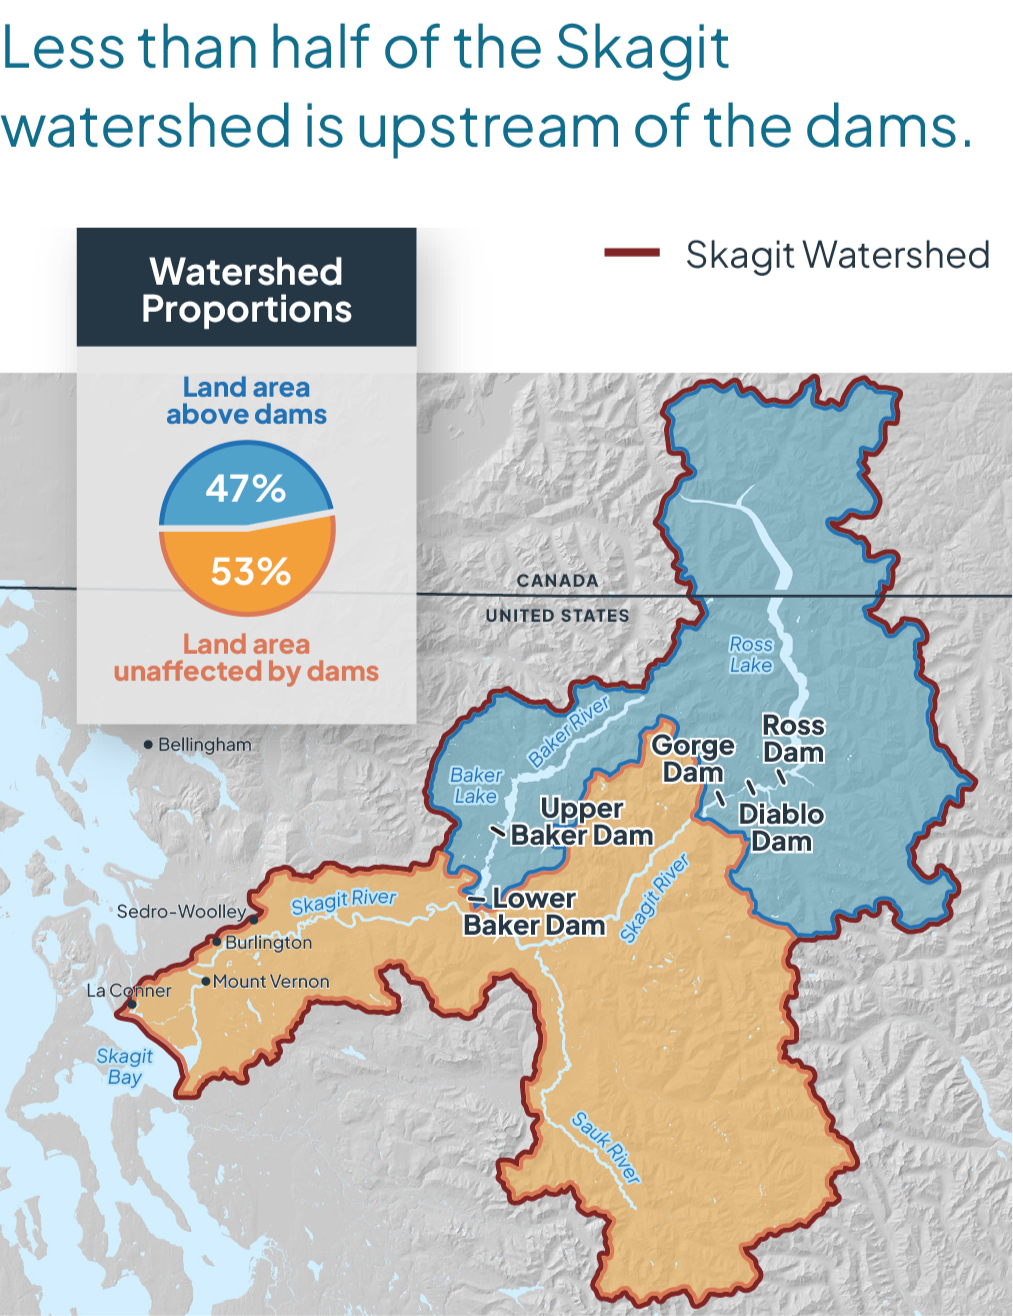
Figure 1. The Skagit Watershed. Image Credit: SC²
The Skagit River system has five major hydroelectric dams. Two of these dams, operated by Puget Sound Energy, are located on the Baker River, a tributary to the Skagit. The other three dams are on the upper Skagit River and are operated by Seattle City Light. The approximate location of each dam can be seen in Figure 1. All five dams produce hydroelectric power while also providing flood control in winter and supplemental flows in summer. When flooding is predicted to occur, the United States Army Corps of Engineers directs operations of the Skagit and Baker dams.
To understand how water flows, it can be helpful to take a simplified view of the watershed, as shown in Figure 2. The dark blue lines represent the Skagit River and noteworthy tributaries. The triangle symbols in the schematic represent the two Baker River dams and the three upper Skagit River dams. The largest tributaries to the Skagit River are the Sauk, Baker, and Cascade rivers. Nookachamps Creek is much smaller, but it is one of the largest tributaries in the lower watershed. During flood events, water flows out of the river and onto the floodplain, likely in many places throughout the watershed. This is why the Samish River is included even though it is not a part of the Skagit River watershed: because the lower Skagit and Samish river floodplains overlap.
Key streamflow gages are shown with the orange dots, including at Marblemount, Sauk River, Concrete, Sedro-Woolley, and Mount Vernon (note that Burlington is marked with an orange circle simply for reference, even though it does not have a gage). This is why flows are often described based on a specific location, such as “flows at Concrete” or “flows at Mount Vernon.” Flows are often discussed in units of cubic feet per second (cfs) of water. The public, governments, and emergency response professionals often rely on river stage—the height of the river at any given location—instead of flow. River stage is often discussed in units of feet.
Figure 2. Schematic Diagram of the Skagit Watershed. Image adapted from Lee et al. (2016)
Skagit Flooding: Role of the Dams
During high flow events, the five dams on the Skagit and Baker rivers are operated to reduce flooding downstream. To understand the role of the dams in flooding, it helps to look at both averages and specific historic flood events.
First, let’s look at model results from the average of the top ten Skagit flood events prior to 2022. The bar plots in Figure 3 show results estimating the proportion of the peak flows (for the Skagit River at Concrete) that originated above the upper Skagit dams (light blue), above the Baker dams (dark blue), and from areas below or unaffected by the dams (orange) for two different scenarios. The bar on the left-hand side of the plot shows the hypothetical peak flow at Concrete that would have occurred if the dams did not exist (based on estimates of “naturalized flows” obtained from Seattle City Light and Puget Sound Energy). The bar on the right-hand side of the plot shows the observed peak flow at Concrete, with the reductions due to dam operations included. Note that the orange bar, which shows flows that are unaffected by the dams, is always the same for the “Without Dams” and “With Dams” bar in each plot. This is because the dams have no influence on these flows. On average, across the top 10 Skagit floods, nearly half of the total flow originates from these areas not affected by the dams. The figure does not include the December 2025 flood event, only because the data from that event was not yet available at the time of this analysis.
The plots in Figure 4 show the same type of results, but for two specific flood events. The left-hand pair of bar plots is the November 2021 flood event. This was a major atmospheric river event, the same storm that caused devastating damage in Whatcom County and British Columbia, Canada. The Skagit River dams were able to dramatically reduce the size of the 2021 flood because most of the precipitation fell upstream of the dams. This can be seen by the reduction in total size of the flood when comparing the “Without Dams” and “With Dams” bars in the left-hand pair of plots.
In contrast, the right-hand pair of bar plots (shaded in gray) show that most of the precipitation for the 1990 flood event fell on areas below or not affected by the dams. In this particular event, most of the precipitation fell in the Sauk River basin, which is not influenced by the dams. As a result, the bar graph shows that the dams could not do much to reduce peak flows in the 1990 flood. The bar chart does show that the size of the 1990 flood was lessened by the presence of the dams, but the effect is small because most of the flows originated from areas not influenced by the dams (orange in each bar).
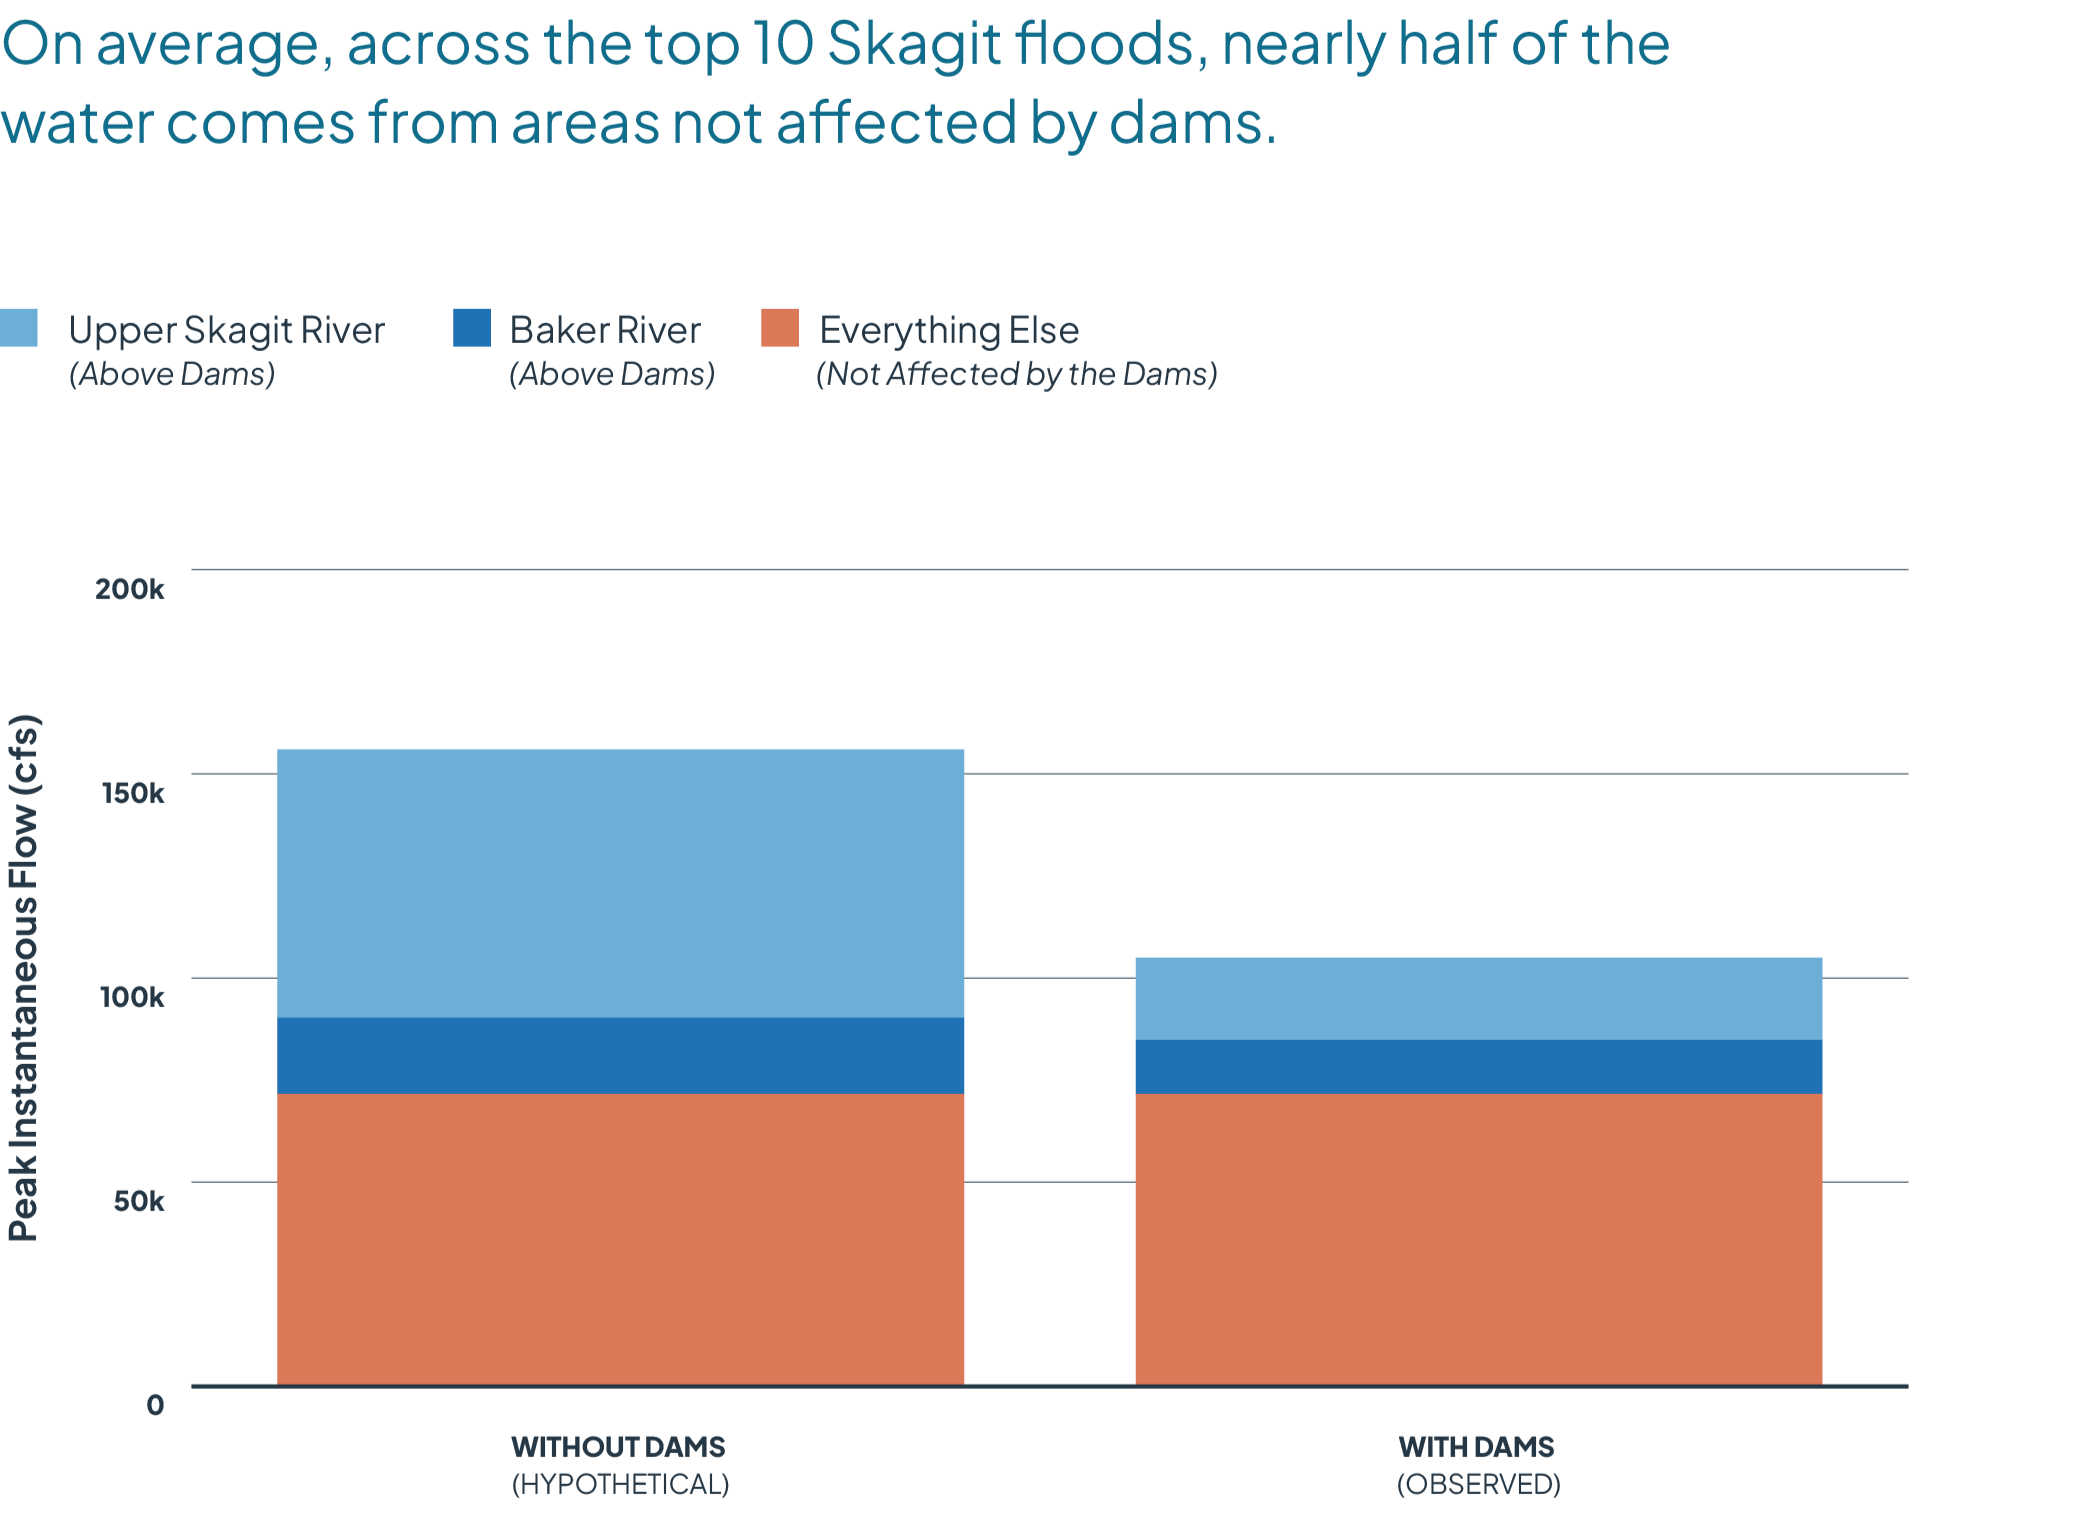
Figure 3. Average peak flow and sources for top 10 skagit river flood events
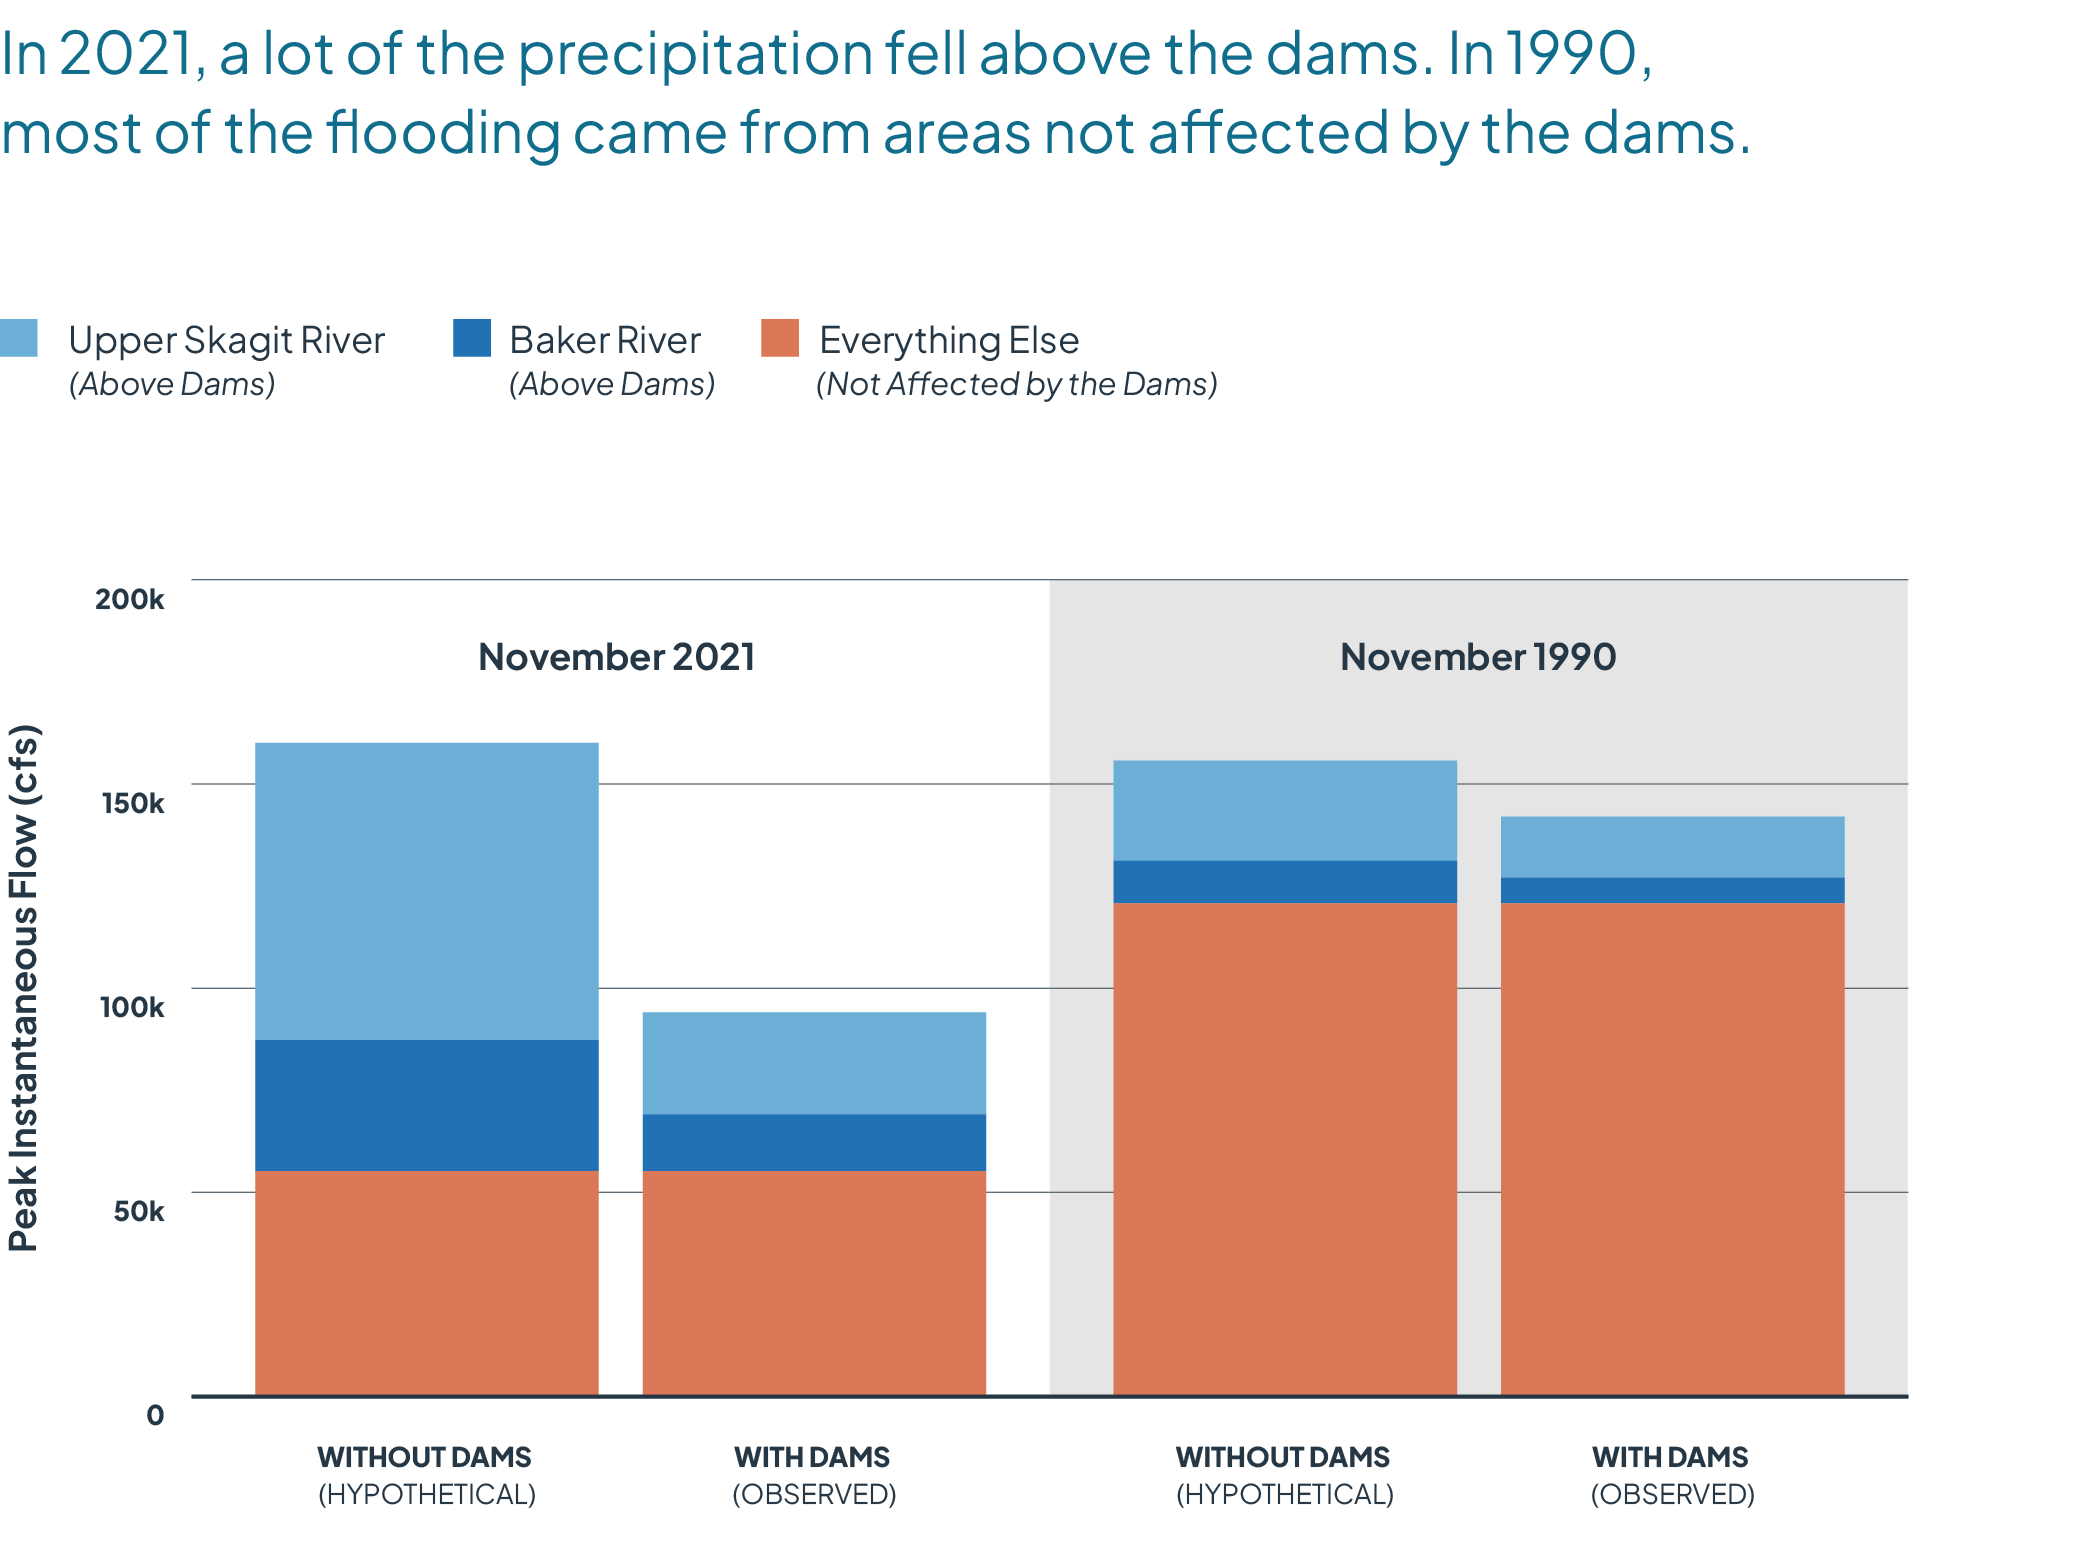
Figure 4. Sources of flood waters for different events
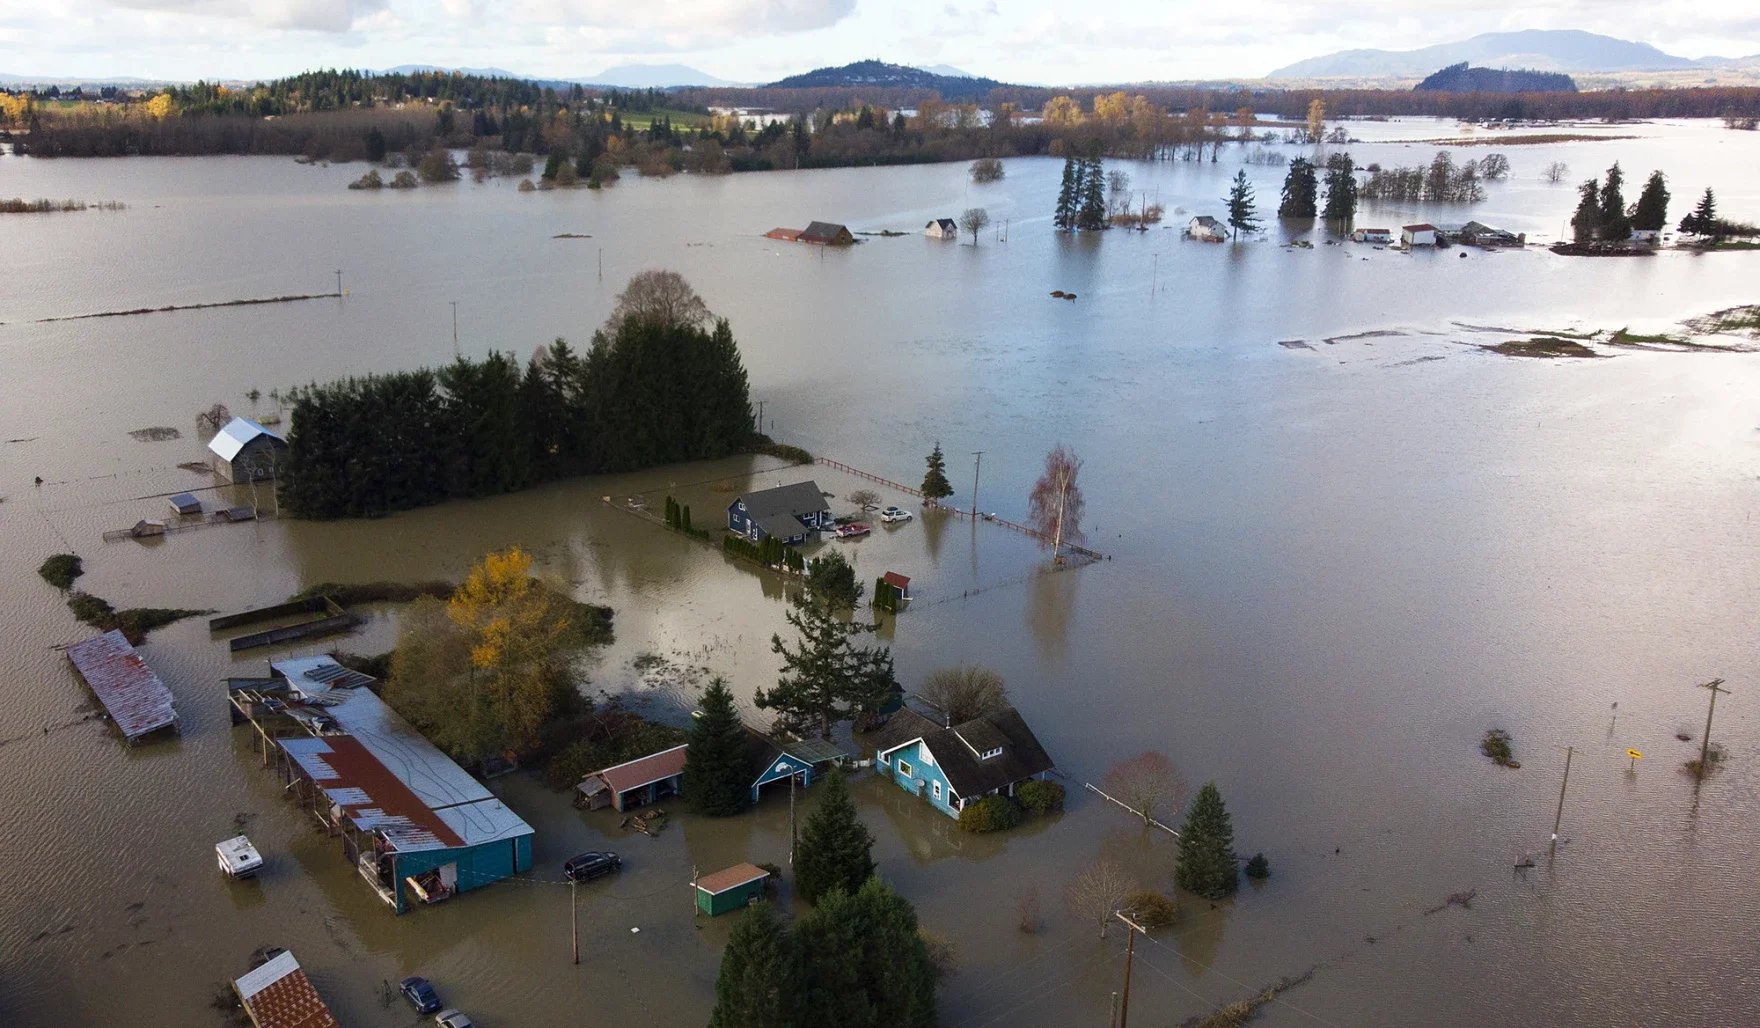
Impacts of a Warming Climate on Flooding
Learn how combined forces, declining snowpack, heavier precipitation, rising sea levels and increased sediment load are all key factors increasing flood risk in the Skagit watershed as we face a changing climate
Flooding November 2021, Mount Vernon
Image Source: NPR
Climate Change & Combining Forces
Skagit flood risk is increasing due to the combined forces of multiple changing climate factors
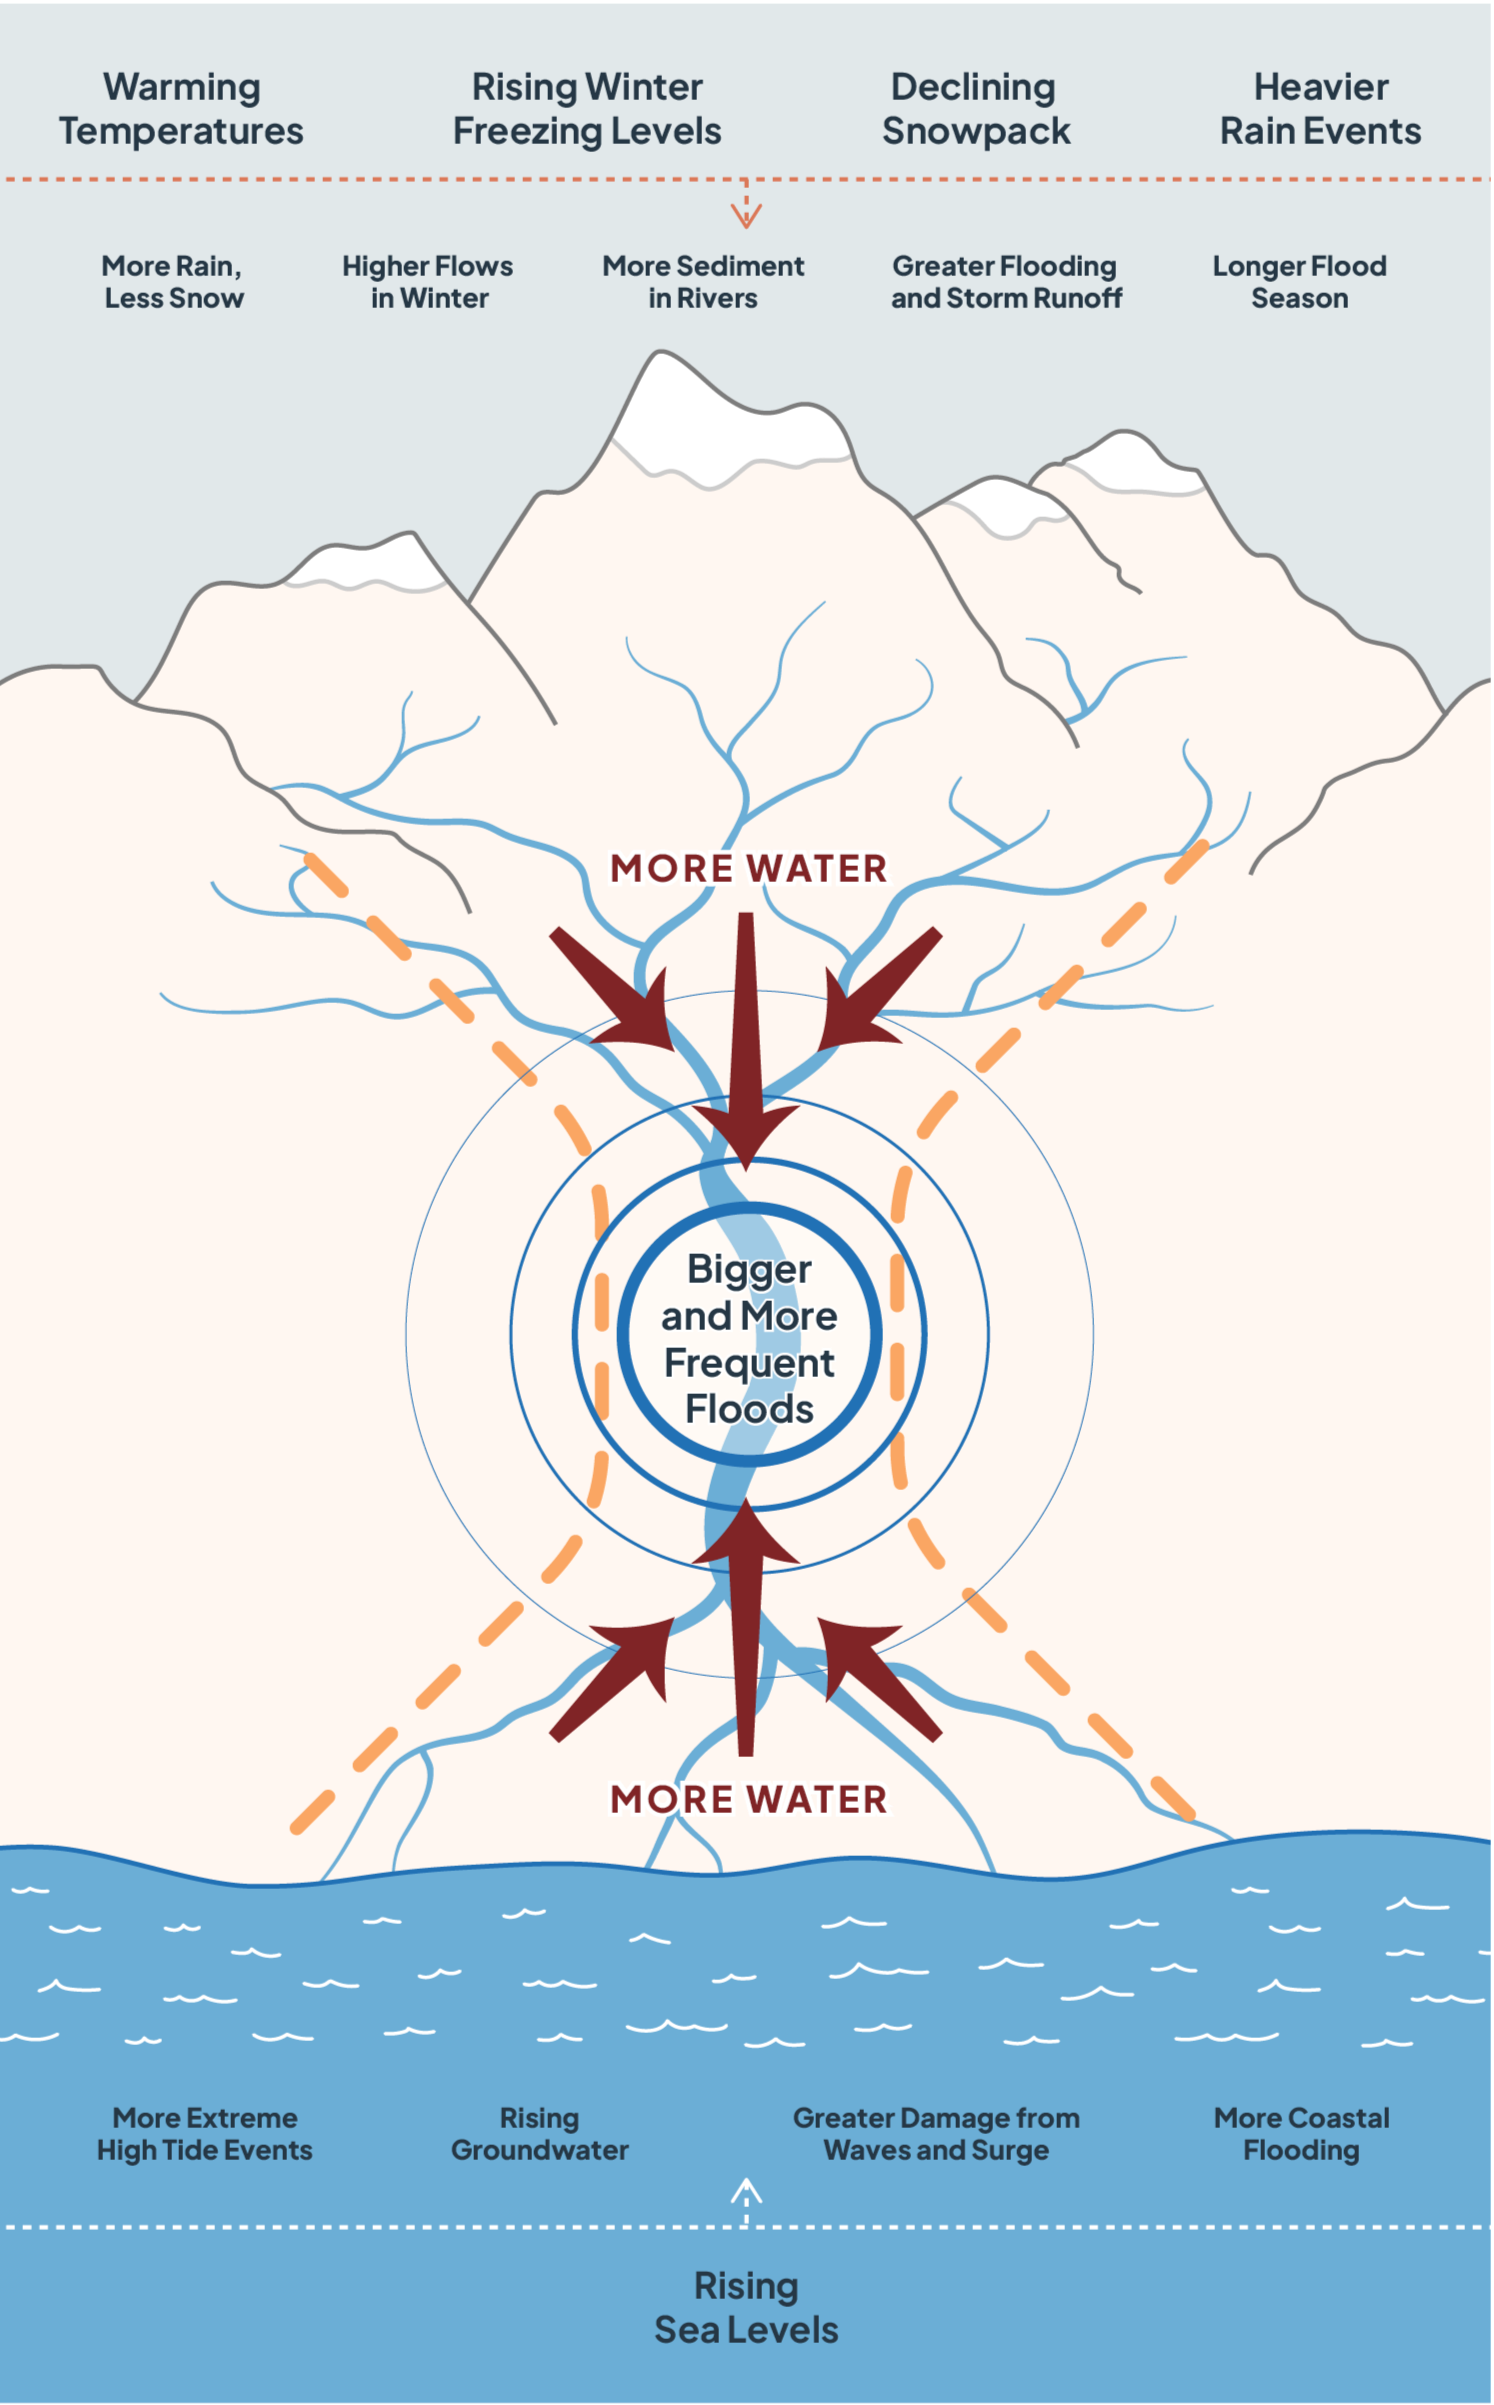
Figure 5. Climate change impacts on flooding. Image credit: SC²
Because of its landscape and geology, the Skagit River is prone to flood even without climate change. The upper watershed covers a huge area of steep slopes and many small streams. Rain and snowmelt flow down the mountains and foothills into three major river branches: the Sauk, Cascade, and Baker Rivers. These branches join the mainstem Skagit River in a narrow and confined valley between Rockport and Concrete, a distance of only eight miles. Much like sand through a two-way hourglass, river flows from the upper watershed and tidal flows coming upstream from the bay meet near Mt. Vernon, Burlington and Sedro-Woolley, resulting in flood events. Dikes and levees on the system only confine water within a channel but are still affected by tidal influence which extends inland close to Mt. Vernon during high tides.
As air temperatures rise, glaciers will continue to melt and shrink and winter freezing levels will rise. As a result of these changes, more precipitation is projected to fall as rain and less as snow, the flood season will extend, and storm events will bring more intense rain. All of these forces loosen more sediment, filling in rivers and tributary streams, and reducing the capacity of the channelized system to carry floodwaters.
At the bottom of the hourglass, sea levels will also rise at the same time river flood levels are increasing. Rising sea levels push groundwater levels closer to the surface and result in more frequent high tides and greater inland surges of water during severe storms. Already, the highest tides of the year are during the flood season. During storm events that cause river flooding, coastal storm surge can also further increase the sea level due to pressure and wind.
The combined forces of more water from the Cascade mountains and the rising Skagit Bay can affect habitat for salmon throughout the watershed. It can also put pressure on existing levees that currently protect farmland, private property, and roads and other infrastructure as water levels in the river flow over infrastructure for more of the winter season.
Declining Snowpack
As snowpack in the northwest declines, flooding increases. One way to think about the effect of warming on snowpack is in terms of the average elevation of the “snowline” – the elevation where precipitation transitions from snow to rain, as illustrated in the figure above (Precipitation refers to all forms of water falling from the sky: snow, rain, hail, etc.).
Snow is important because when there is less snow and more rain, the same amount of precipitation can lead to a larger flood. Although the snowline varies from one storm to the next, the average snowline is expected to rise with warming. As the snowline rises, storms bring more rain and less snow to the Skagit watershed. With this increase in rainfall, there is more water available to contribute to flooding.
Research shows that spring snowpack has already declined by about 15-30% across the western US. Modeling for the Skagit estimates it will be at about 50% of historical levels, on average, by the 2080s.
Overall, declining snowpack is probably the biggest driver of changing flood risk on the Skagit River. Although the changes are comparatively smaller, another important factor is precipitation.
Figure 6. Declining snowpack Image credit: SC²
Heavier Precipitation
This also means changes in the intensity of precipitation (the rate and volume of precipitation delivered during a storm) is likely to affect flooding. Climate models project that the heaviest precipitation events will become 22% more intense by the 2080s (range: +5 to +34%). Research is ongoing, but current studies suggest that the primary reason for the increase in precipitation intensity is simply that warmer air holds more water.
An important detail to clarify is that the research does not find a large change in other characteristics of these storms (pressure, winds, location, etc.). Instead, the research suggests that – other than precipitation intensity – storm characteristics are similar now and in the future.
Modeling precipitation is more difficult than modeling temperature, so there is more uncertainty in these results. However, current science is consistent in showing an increase in the intensity of heavy rain events, meaning that we expect future precipitation events to lead to bigger floods, exacerbating the trend we’re already seeing due to decreases in snowpack.
Sea Level Rise
In coastal areas and the lower reaches of the Skagit and Samish rivers, sea level rise can contribute to flooding. In addition to elevating routine high tides, sea level rise can affect flooding in two ways: first, by leading to higher flood waters along the coast, and second, by slowing flows coming off the land or in rivers. This is called a “backwater effect”, where higher coastal water levels make it harder for runoff to drain to Puget Sound until the tide comes back down again.
Much of the Skagit delta is already “sub-tidal”, meaning that the land is below the current normal high tide and would be submerged by coastal waters in the absence of dikes. Because of these sub-tidal elevations, there are already times when drainage off the Skagit Delta is delayed due to high tides. With higher sea levels projected, this will happen more often.
In Skagit, Padilla, and Samish bays, models project about 1.5 to 2 feet of sea level rise by 2100 (you can browse the projections in this tool). Similar to the findings for precipitation, research does not indicate a change in storm characteristics (pressure, winds, currents) that would lead to changes in storm surge or waves. Instead, future coastal storm events are higher simply because the base sea level is higher. The figure above illustrates what this means for coastal flooding.
Figure 7. Factors that affect coastal flooding. Image credit: SC²
Increased Sediment
Scientists think of rivers as conveyor belts for sediment moving down from our mountains and valleys, as illustrated in Figure 8. Rain, runoff, and landslides mobilize sediment over land, eventually carrying it to creeks and rivers. Rivers also erode and mobilize sediment. In both cases, sediment is transported downstream and deposited in the lower river, Skagit Bay, and Puget Sound. This is why rivers form deltas at their lowest elevations: as sediments deposit over time they create flat areas where river channels can form and meander. With climate change, we expect the volume of sediment transport to increase for a variety of reasons, including:
receding snowpack and glaciers are exposing new soils to erosion
heavier precipitation can increase both erosion and landslide risk
higher river flows can both erode river channels more rapidly and transport more sediment downstream
At the same time as more sediment is being moved downstream, sea level rise is slowing flows in the lowest river reaches, potentially causing more sediment to deposit on the river bottom. In natural systems, excess sediment can be deposited on the floodplain during flood events. When dikes are present, sediment is deposited in the channel or transported downstream. This can reduce the river’s capacity to convey flood waters without overtopping its banks.
Better understanding of the role of sediment in flooding is critical. For example, one Skagit study used the observed relationship—that higher flows can transport more sediment—to estimate future changes in sediment transport. They found that, due to higher flows, annual average sediment transport in the Skagit River could more than double on average by the 2080s, and that winter sediment transport could more than quadruple (Lee, Hamlet and Grossman, 2016).
Figure 8. Flow of sediment. Image credit: SC²
Annual average sediment transport in the Skagit River could more than double on average by the 2080s, and winter sediment transport could more than quadruple.
Putting It All Together: Projected Flood Changes in the Skagit
As illustrated in the hourglass Figure 5, the combination of rising snow elevations, more intense precipitation, increasing sediment transport and deposition, and sea level rise all contribute to an increasing risk of flooding in the Skagit River.
The most comprehensive study on climate change and flooding for the Skagit River estimates that today’s 100-year flood at Mount Vernon would increase by +49%, on average, by the 2080s. Looking at the results another way, the same study found that today’s 100-year flood (or 1% annual chance event; read more about flood frequencies here) would happen about four to five times as often by the 2040s (i.e., becoming a 20-year to 25-year event instead of a 100-year event). These projections assume the five dams are operated in the same way they were operated prior to the recent Seattle City Light relicensing agreement.
The same study looked at possible changes in dam operations and found that even with adjustments to retain additional flows, the 100-year event is still projected to increase by +42% – only slightly lower than the increase of +49% without any changes. This is in large part due to the volume of flows that originate in parts of the watershed that are not influenced by the dams (see the discussion on Skagit Flooding above).
The projections in Figure 9 provide the average change in the 100-year peak flow event. However, it is important to remember that every storm, and every resulting flood, is different. This means different storms will be affected by warming in different ways. The figure below illustrates this by showing model estimates for how five historic floods would change with warming. For example, if the 2006 Skagit flood were to occur again in the 2040s or 2080s, how much higher would the flows be?
As an example, the modeled 2006 event is shown in the last three bars on the far right of Figure 9. The first bar is the 2006 historic event, the second bar is the 2040s projection, and the last bar shows the same event in the 2080s. As in “With dams” and “Without dams” figures above, the light blue bar is the flow originating from above the Skagit dams. The dark blue color is the flow coming from above the Baker dams. The orange color is everything else – all areas where flood storage is not provided by the dams.
Figure 9 contains this same structure for five historic events looking from left to right: 1921, 1983, 1986, 1995 and 2006. In order to simplify interpretation, these results do not include the effects of dam management. The events were chosen because they are the top “unregulated flow” events – in other words, if there were no dams, these would have been the biggest flood events in the record. Because the figure is adapted from Lee et al. (2016), results are not available from the more recent 2021 and 2025 events.
Looking at the results across the entire plot, models project an increase for all five historic events (higher bars for the 2040s and 2080s, in all cases). It also shows that some events change relatively little. For example, the model projects that the 1995 event would lead to flows that are only +14% higher by the 2080s, while the 1983 event is projected to increase by +161%. Overall, the 1921 and 1995 events show smaller increases whereas the increases for 1983, 1986, and 2006 are substantial.
What we are seeing is the contrast between warmer and colder storm events. Warmer events – the flood events of 1921 and 1995 – already have a high proportion of rain compared to snow. For those events, the shift from snow to rain is not as important, so the main effect driving the increases is only the projected increases in precipitation intensity.
In contrast, colder events – the floods of 1983, 1986 and 2006 – have historically had a higher proportion of precipitation falling as snow. With warming, these events increase dramatically because the precipitation will increasingly fall in the future as rain instead of snow, resulting in increased flows during flood events.
Figure 9. More rain, less snow — a big effect on colder flood events. The figure is adapted froom Lee et. all (2016), so data are not available for the more recent 2021 and 2025 floods.
Today’s 100-year flood could happen about four to five times as often by the 2040s, becoming a 20-year to 25-year event instead of a 100-year event.
From Peak Flows to Flooding: New Flood Model
Our discussion so far has focused on the drivers of flooding: declining snowpack, heavier precipitation, sea level rise, sediment dynamics. Ultimately, however, most planning and emergency response is based on model estimates of the depth, extent, and speed of flood waters.
With leadership from the Swinomish Indian Tribal Community, SC² participated in a study that developed a new flood model with resultant maps of current and future flooding extending from Marblemount to Puget Sound. You can read more about the project, Understanding Current and Future Skagit Flood Risks: New Modeling Capabilities, and view the flood modeling results, on our project page.
Figure 10. Understanding Current and Future Skagit Flood Risks includes map bundles that model flood depth, depth velocity and duration maps for flood scenarios throughout the Skagit watershed.
Additional Resources
2015 Flood Mapping Tool: The results shown in this tool are not based on the new hydraulic model outputs found in the 2026 flood report, but a coarser level application described in Hamman et al. (2016).
Northwest Science Special Issue article Combined Effects of Projected Sea Level Rise, Storm Surge, and Peak River Flows on Water Levels in the Skagit Floodplain