
Weather and Climate
The Skagit Valley’s environment, economy, and communities have been shaped over time by weather and climate. We can think of weather as a snapshot of conditions in the near-term, such as amount of cloudiness or sunshine, temperature, and wind direction at a specific location (i.e., Mt. Vernon) and point in time (typically minutes to days or even weeks). Climate, on the other hand, is the average of weather conditions over longer time periods, raging from months and years to decades, centuries, or longer. For example, while the weather forecast for Mt. Vernon on August 30 was a high of 69°F, the average high for that day (the climate “normal” based on 30 years of record) is 73°F.
Weather: What We Get
Weather is a snapshot of conditions in the near-term, such as the amount of cloudiness or sunshine, temperature, and wind direction at a specific location and point in time (typically minutes to days or even weeks). Weather happens on any given day, month or season. See Fugure 1.
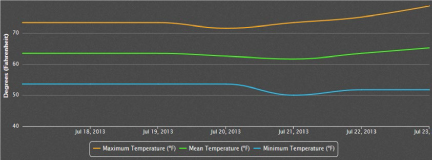
Figure 1. Observed daily maximum, minimum, and mean temperature at Skagit Regional Airport from July 18–22, 2013. Source: weathersource.com
Climate: What We Expect
Climate is the average of general weather conditions over longer time periods, ranging from decades to centuries or longer. Climate happens over time. See Figure 2.
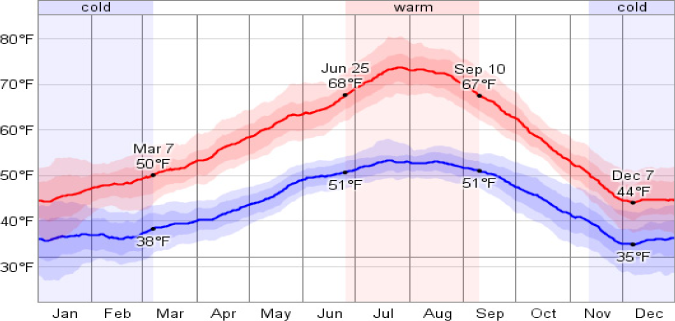
Figure 2. The average minimum and maximum temperatures for Mt. Vernon from 2003–2012. The bands of color denote the normal range of variability. Source: weatherspark.com/averages/29830/Burlington-Mount-Vernon-Washington-United-States
In any given season, year, or decade, sustained natural variations in ocean temperatures, winds, and other factors will cause climate to deviate from average for that time period.
Unlike natural climate variability, climate change is recognized as having a direct association with human activities that emit heat-trapping gases such as carbon dioxide, methane, and nitrous oxide into the atmosphere. Since the start of the Industrial Revolution around 1750, the concentration of carbon dioxide, methane, and nitrous oxide has increased 35%, 142%, and 18%, respectively. Long-term natural climate archives like ice cores have shown us that these changes are enormous by geologic standards.
For example, analysis of Antarctic ice cores has helped scientists determine that the current concentrations of carbon dioxide and methane in the atmosphere “by far” exceed the natural range of these gases over the last 650,000 years. And as greenhouse gases have increased, global temperature has increased. Between 1906 and 2006, average annual global temperature increased 1.3°F (IPCC 2007); warming since the 1950s is “very likely” due to human-caused increases in greenhouse gases, meaning there is more than a 90% chance that human activities played a significant role in the observed warming during that time.
Climate variability and climate change are occurring simultaneously, but operating under different timescales. This distinction is important when thinking about how we will experience climate change and climate impacts. Natural variability will continue to affect Pacific Northwest climate on annual to decadal time periods even as climate change increases the average temperatures around which climate varies over longer timeframes (decades to centuries). This means, for example, that we will continue to see colder than average years (such as the La Niña winter and spring of 2010–2011) and warmer than average years in the coming decades even as long term global and regional temperature trends increase.
Another example is the winter and spring of 2011, which saw precipitation in the North Cascades at 123% above average (1970–1999) and exceptionally high snowpack throughout the Cascades late into the spring, was a La Niña and a cold phase Pacific Decadal Oscillation year. Neutral phases of both cycles are characterized by average winter conditions.
A fuller description of these natural variations can be found here.