
Winter Freezing Level
As winter temperature has increased, the winter freezing level in the Skagit has risen. The winter freezing level is the elevation where the temperature is cold enough for precipitation to fall as snow, not rain. The winter of 2014–2015 had an average winter freezing level of 6,000 feet. That’s 1,400 feet above the 1948–2015 average elevation and 400 feet higher than it had ever been since records began in 1948. Indeed the average winter freezing level in the Skagit has risen hundreds of feet since 1948.
More Rain, Less Snow
Based on projected temperature increases, the Skagit basin will continue to see increases in average air temperatures. Rising freezing levels in winter increase the land area in the Skagit Basin that captures rain instead of snow, resulting in the potential for more water to enter the river during the fall and winter and less during the summer. Figure 1 shows how rising winter freezing levels can relate to the amount of water entering the river.
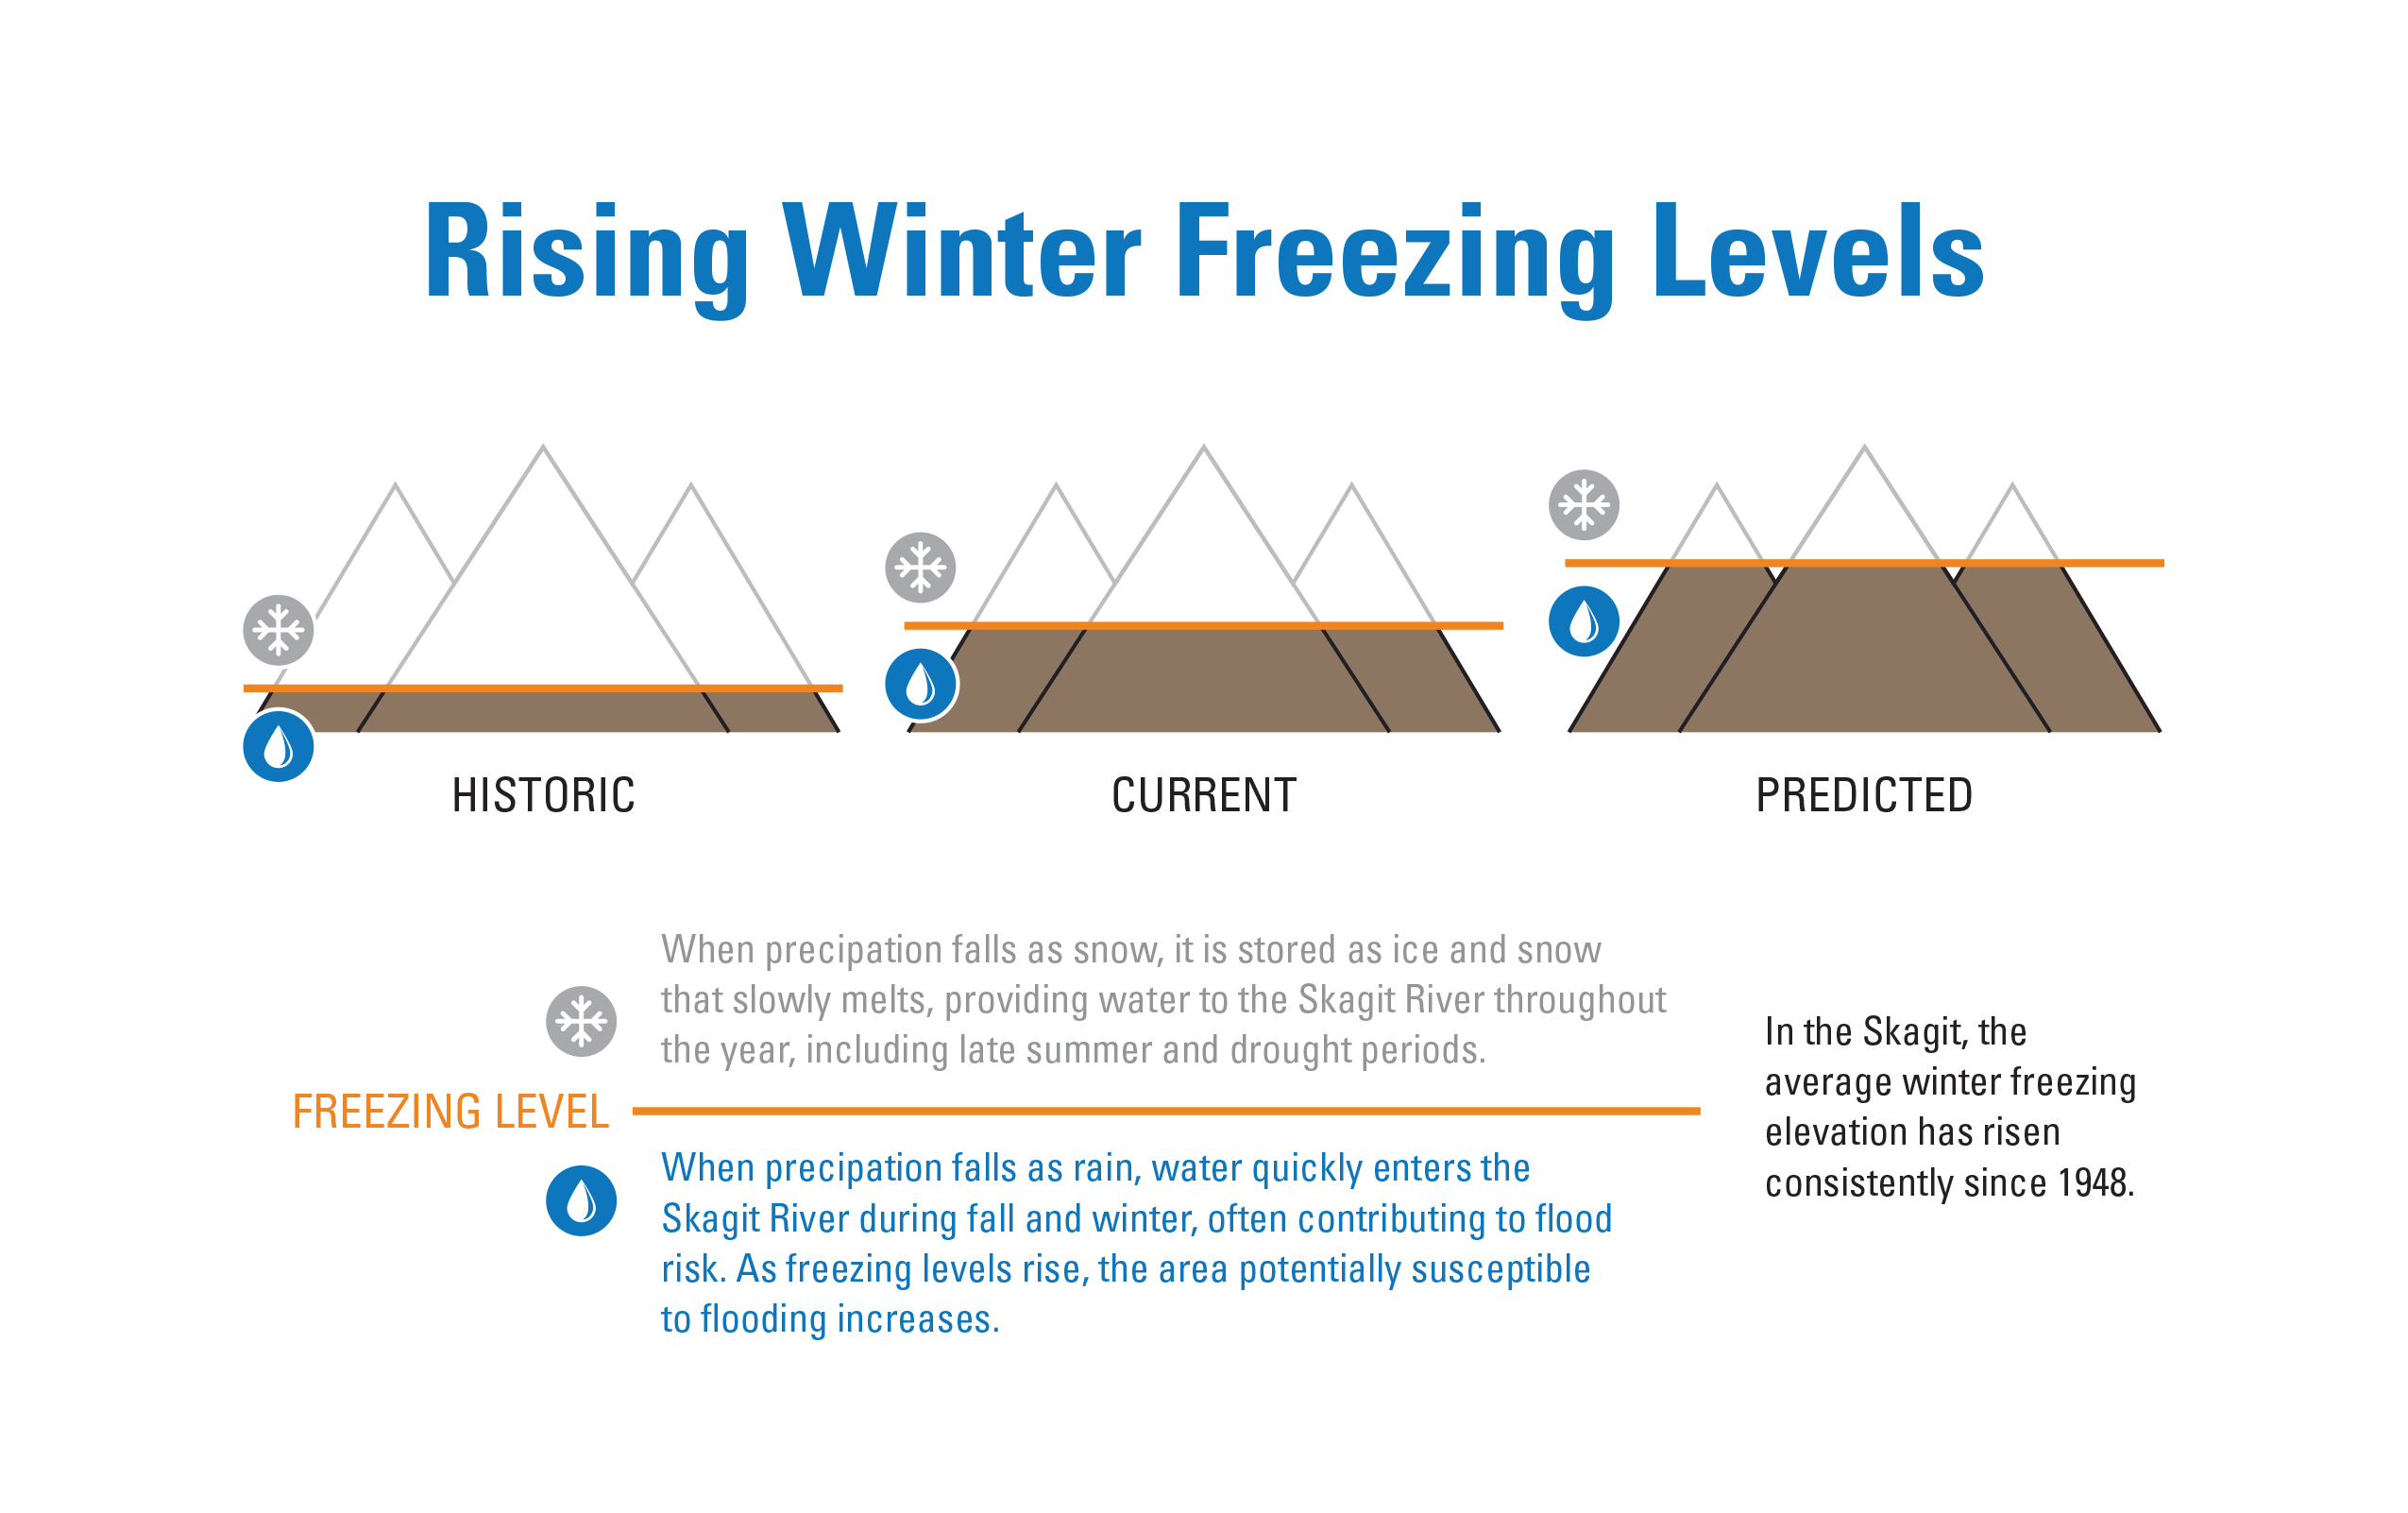
Figure 1.
In the maps of the Skagit Drainage Basin seen in Figure 2, the light blue shading indicates the snow dominated zone and the darker blue indicates the Rain on Snow (ROS) zone. The charts in Figure 3 show that looking into the future, the Skagit region may see a doubling of the acres of land capturing rain instead of snow between 1991 and 2080. The charts in Figure 3 turn the visual map of figure 2 into a quantified understanding of the projected changes.
These changes increase flood risk in the Skagit basin and also contributes to the predicted shifts in the timing and magnitude of stream and river flows that may have other impacts even at lower than flood levels. Changing winter freezing elevations also impact erosion, forest ecology, wildlife, and transportation, among other things.
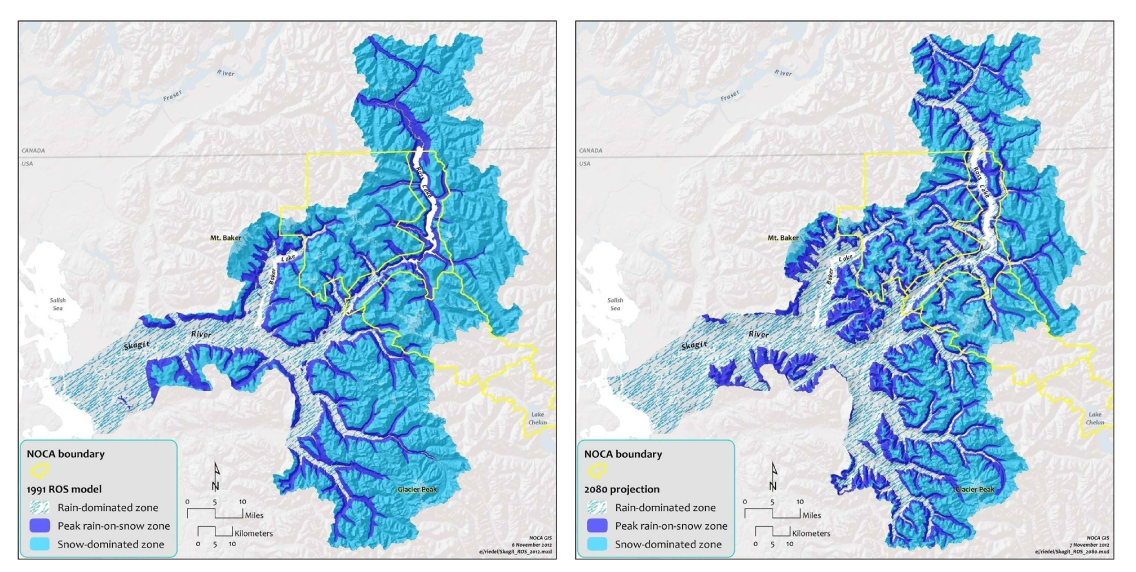
Figure 2.
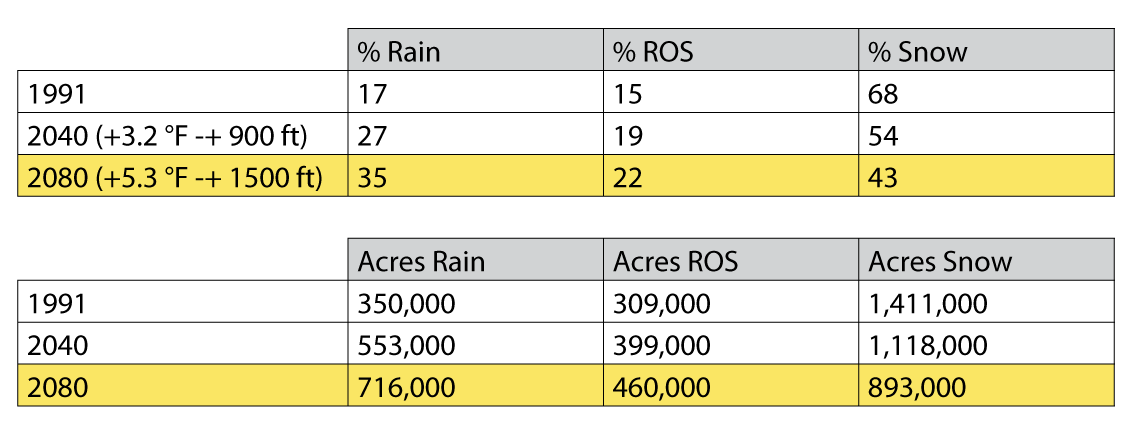
Figure 3.
Dr. John Riedel calculated the changing freezing level using NOAA’s Western Regional Climate center site. Dr. Riedel analyzed the data from the Diablo Dam weather station for the months November to April to calculate the averages. The data on the site goes back to the 1950s and is available for any weather station in the United States.