
Flood Risk: Rivers
Subsections of this page include:
- Historical Record: Bigger Flood Events Shifting to the Fall and Winter
- The Skagit River Flood Record
- Future Projections Indicate More Water on Average During Flood Season
- Future Projections: Bigger Floods
- Flood Risk Increasing Despite Dams
- How Does a Warming Climate Increase Flood Risk?
- Skagit Basin Changes Increase Flood Risk
- Longer and More Intense Flood Season
- More Rain from Severe Storms
- More Rain, Less Snow
- More Sediment in Rivers
- Erosion of Exposed Soil Creates Sediment
- How Quickly is the Skagit River Filling with Sediment?
Historical Record: Bigger Flood Events Shifting to the Fall and Winter
Annual peak flows of the Sauk River for the past 84 years are shown in Figure 1, below. As an undammed river, the Sauk provides important information about the changing nature of climate and runoff in the Skagit basin.
- The mean annual flood (MAF) from 1975–2012 is 40% higher than the MAF from 1929–1974 (P=0.0024).
- Four of the five highest annual peak flows on record have occurred since 1975.
- The highest annual peak flows now occur in winter and are becoming more frequent.
- Spring peak flows are becoming smaller and less likely to be the annual peak.
These observed changes in seasonal flood risk are consistent with observations of warmer temperatures and more intense storms in the latter parts of the historical record.
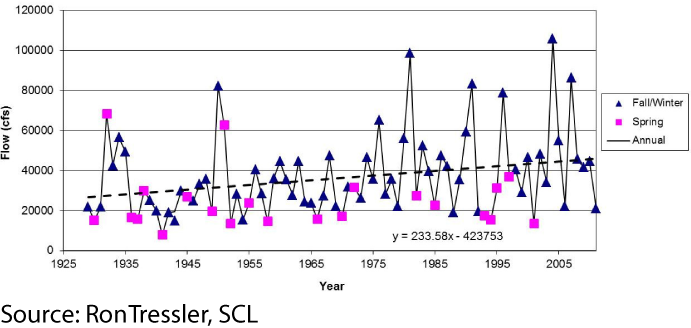
Figure 1. Magnitude and Timing of the Annual Peak Flood on the Sauk River. Source: Ron Tressler, SCL
The Skagit River Flood Record
Historical sources provide information critical to understanding flood mechanisms and future flood risks in the Skagit Basin. Discharge numbers are highly disputed due to their regulatory importance and complexity of measurement. Factors such as levee failures, log jams and other factors complicate gage measurements, estimates and numbers. Numbers are provided here for a sense of range and magnitude.
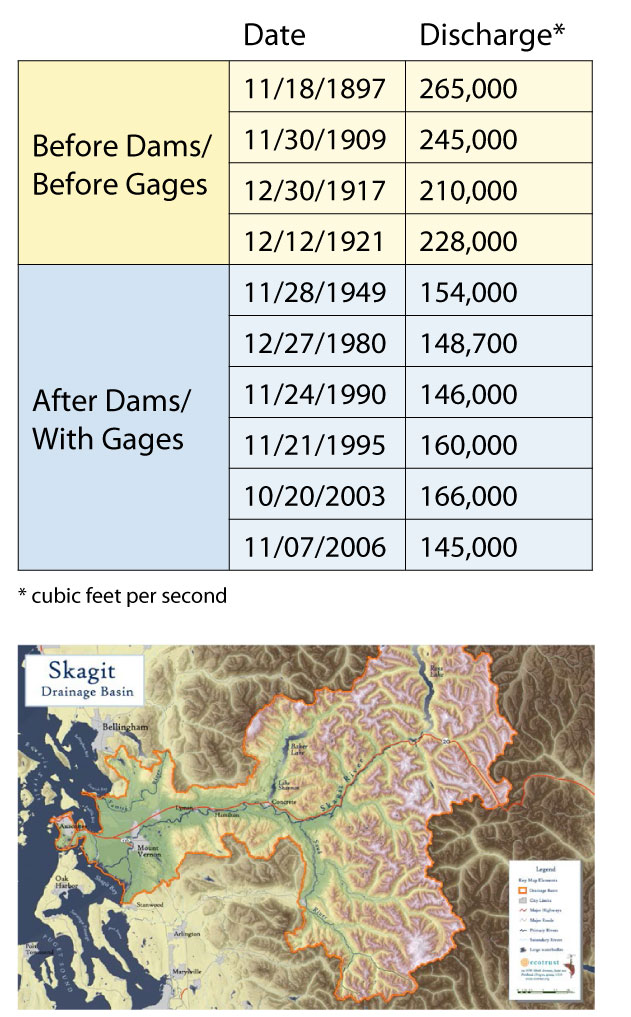
Ten largest Skagit River floods as reported by USGS at the Concrete Gage
By studying historical flooding events, scientists can better understand the complexities of a specific location and assess changes in hydrology. Several geologic factors combine to make the Skagit River flood-prone. These factors include a large basin, steep slopes, a dense drainage network, and a circular watershed that brings the three main branches of the Skagit together within the 8 miles between Rockport and Concrete.
Future Projections Indicate More Water on Average During Flood Season
Historically, the undammed Skagit River has produced the highest monthly volumes of streamflow during the spring and early summer months as melting snow filled the river. Because warming will mean less snow and more fall and winter precipitation falling as rain, scientists project the river will shift to more rain-dominant behavior in the future with peak monthly flows occurring in the fall and winter months. This increase in streamflow in fall and early winter is a key determinant of increasing flood risk in the future projections.
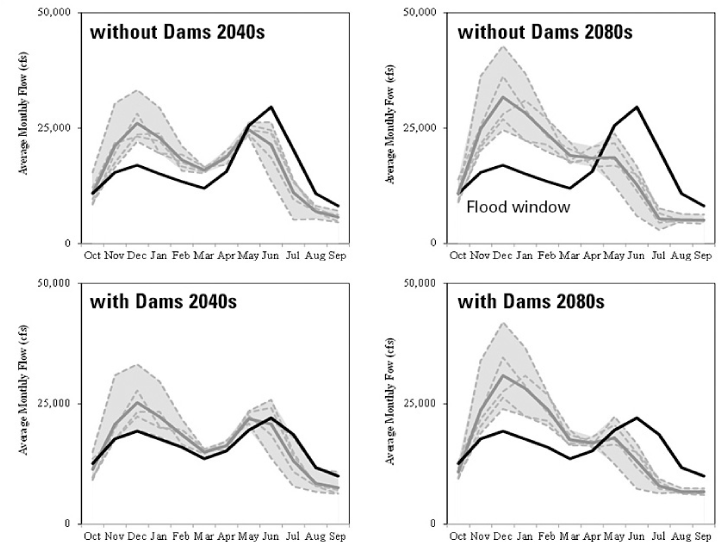
Figure 2. Historical and projected future monthly average flow for the Skagit River at Mt. Vernon.
Black lines: historical baseline simulations. Gray bands and dark gray line: Range of five future climate projections and mean of the future projections, respectively. Source: Lee and Hamlet (in preparation).
Future Projections: Bigger Floods
Under current flood control practices, the magnitude of a dam-regulated, daily-average 100-year flood event is projected to increase by 23% by the 2040s, and by 49% by the 2080s (Figure 3). By the 2040s, the historical 100-year flood occurs every 22 years, and a historical 33-year flood occurs every 7‑years. By the 2040s, the dam-regulated 100-year flood exceeds the historical 100-year flood without dam protection.
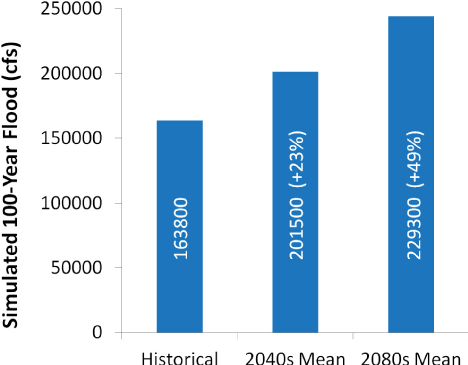
Figure 3: Summary of regulated flood impacts (simulated daily average 100-yr flood) for historical conditions and projected future conditions for the 2040s and 2080s.
Flood Risk Increasing Despite Dams
Flood control operations at Ross and Upper Baker dams reduce the historical 100-year flood event about 12% by capturing flow from the headwaters. However, Skagit River dams will likely do little to reduce the risk of future climate-related extreme flood events. Increasing reservoir storage in the model simulations, for example, only reduced the 100-year flood by 2% for the 2040s and 7% for the 2080s; compared to an overall projected increase of 23% by 2040 and 49% by 2080.
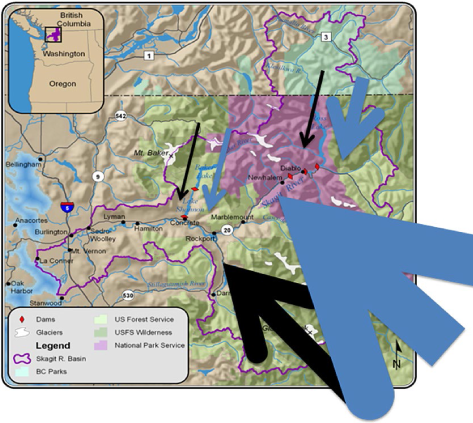
Figure 4. Graphical illustration of the simulated contribution of peak flows from above and below dams for historical (black) and projected future (blue) conditions.
The inability of the dams to substantially reduce projected future flooding is explained by the relatively small fraction of the flow that originates above the dams during flood events (Figure 4, Table 1). Black arrows represent historical flood flows from each source area (size of arrow represents flood flow from each source); blue arrows represent the projected future flood flows for the same storm. Note that most of the flow originates downstream of the dams (red diamonds on the map).

Flows for Ross and Baker Lake originate above the dams; other tributary flows include the Sauk River and Bacon Creek that enter the system below the dams. Source: Lee and Hamlet (in preparation)
How Does a Warming Climate Increase Flood Risk?
As temperatures rise, the vulnerability of the Skagit Basin to flooding increases. More land contributes floodwater, more intense storms bring more rainfall in shorter periods of time, and more sediment decreases the capacity of the Skagit River to carry flood waters to a rising sea. All these changes compound the risk of Skagit flooding.
|
||||
|
||||
Skagit Basin Changes Increase Flood Risk
Longer and More Intense Flood Season
Flooding in the Skagit typically occurs during late fall, winter and spring. As temperatures increase and freezing levels (snow elevations) rise, more winter precipitation is expected to fall as rain rather than snow. Snowmelt will occur earlier. This means the risk of fall and winter flooding to downstream communities will increase over time, as illustrated by the difference between historical (blue line) and future river flows (red line and shading) in Figure 1.
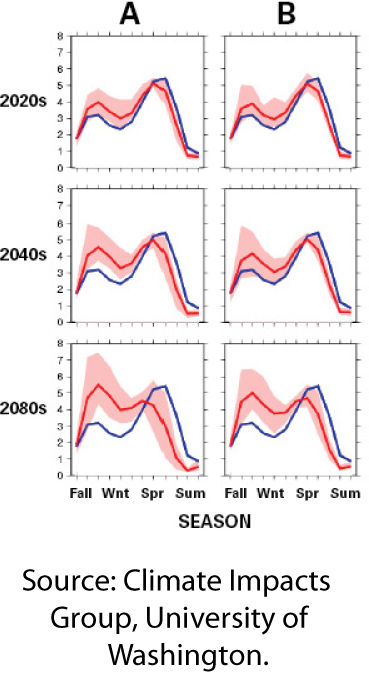
Figure 1.
More Rain from Severe Storms
More intense storms bringing more rainfall over short periods of time are projected, along with seasonal changes: drier summers, and wetter falls, winters and spring. However, changes in the total amount of rainfall over the course of the year are projected to be small (in the range of +1 to 4%). Source: Mote and Salathé, 2010.
More Rain, Less Snow
Based on projected temperature increases, the Skagit basin will continue to undergo substantial changes in average conditions. Rising freezing levels in winter increase the land area in the Skagit Basin that captures rain instead of snow, resulting in more water entering the river during the fall and winter and less during the summer.
In the maps of the Skagit Drainage Basin (Figure 2), the light blue shading indicates the snow dominated zone and the darker blue indicates the Rain on Snow (ROS) zone. The charts (Figure 3) show that looking into the future, the Skagit region may see a doubling of the acres capturing rain instead of snow between 1991 and 2080.
These changes increase flood risk in the Skagit basin. Changing winter freezing elevations also impact erosion, forest ecology, wildlife, and transportation, among other things.
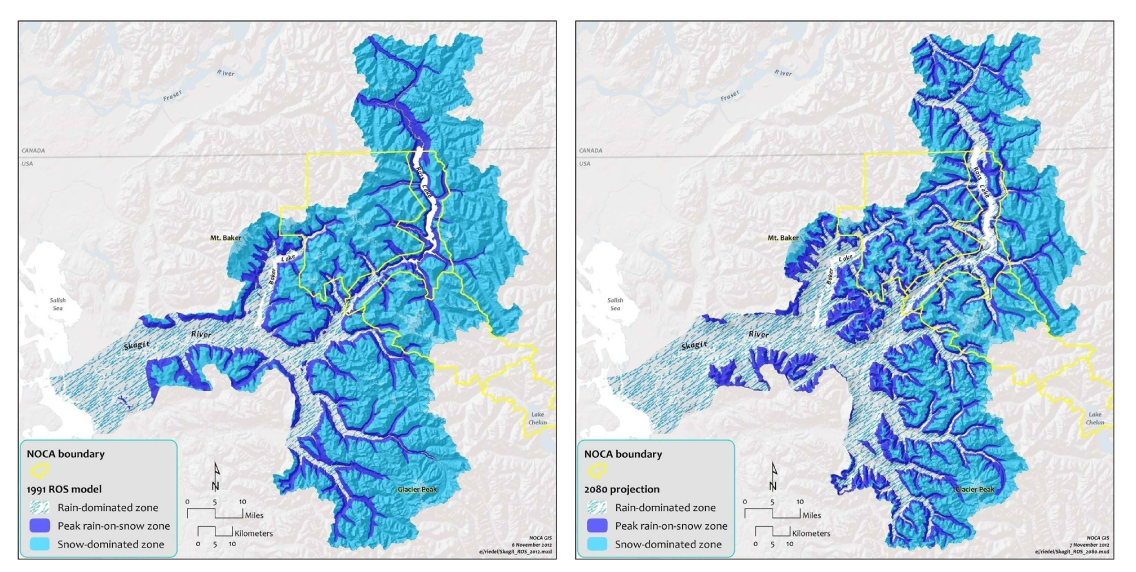
Figure 2.
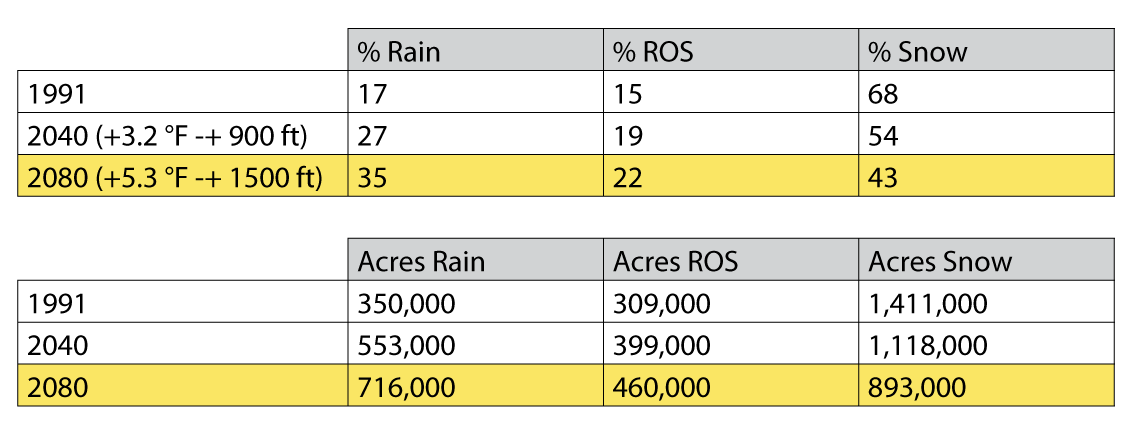
Figure 3.
More Sediment in Rivers
Erosion of Exposed Soil Creates Sediment
With rapid glacial and snowfield retreat and rising snow elevations, more soil surface is exposed to erosion. Glacial decline exposes significant amounts of loose materials, as seen in Figure 3.
Already, the Skagit River delivers more sediment to Puget Sound than any other river (2.8 million tons per year), filling in Skagit Bay (see Figure 5). Areas in red accumulated almost 80 feet since 1939. The amount of newly exposed soils has not been quantified, nor future projections modeled. More sediment in the Skagit River may reduce space for floodwaters and increase the potential for overtopping the levees during flood events.
Source: USGS, available at http://pubs.usgs.gov/fs/2011/3083/
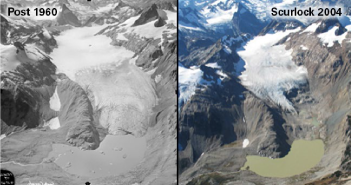
Figure 4.
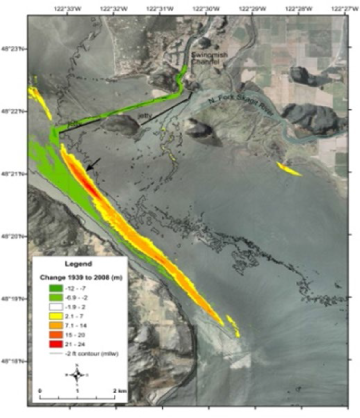
Figure 5. Change in the elevation of Skagit Bay Seafloor: 1939–2008.
How Quickly is the Skagit River Filling with Sediment?
In one reach of the lower Skagit near Mt. Vernon, 10 feet of sediment has accumulated since 1999. The sediment load carried by the Skagit River is projected to increase significantly as noted in Figure 6. Current monitoring of sediment accumulation in the Skagit river bottom is not being done, nor has future modeling been completed.
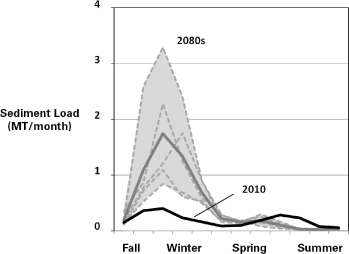
Figure 6. Increase in projected sediment loads (in millions of tons per month)
More information is available in the recent Northwest Science Special Issue article “Combined Effects of Projected Sea Level Rise, Storm Surge, and Peak River Flows on Water Levels in the Skagit Floodplain.”