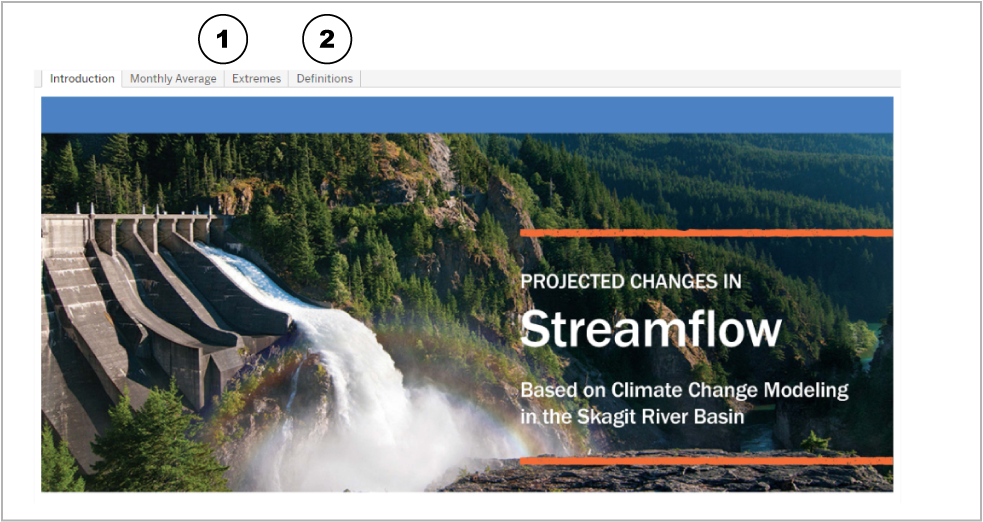
Projected Changes in Streamflow
As the climate warms, people want information on what to consider as they plan for potential changes in streamflows. The following visualizations show a large set of outputs from a modeling study conducted by researchers at the University of Washington Civil and Environmental Engineering Department and supported by several organizations with a common interest in understanding a potential range of future conditions (Seattle City Light, Swinomish Indian Tribal Community, and the Sauk-Suiattle Indian Tribe in partnership with the Skagit Climate Science Consortium). The study is available at: https://www.hydroshare.org/resource/e5ad2935979647d6af5f1a9f6bdecdea/. The study modeled projected changes in streamflows at 20 locations in the Skagit Watershed.
These locations include:
- Red Cabin Creek
- Finney Creek
- Jackman Creek
- Illabot Creek
- Cascade River
- Jordan Creek
- Bacon Creek
- Marblemount to Newhalem
- Gorge
- Diablo
- Thunder Creek
- Ross
- Sauk River near Sauk
- Big Creek
- Sauk River at Darrington
- Sauk River above Clear Creek
- Sauk River above White Chuck
- White Chuck
- North Fork Sauk River
- South Fork Sauk River
Once on the home Introduction page, it will be possible to select the visualization. The visualization is:

- Monthly Averages

- Definitions of terms used in the visualization are also available.
Monthly Streamflow Average
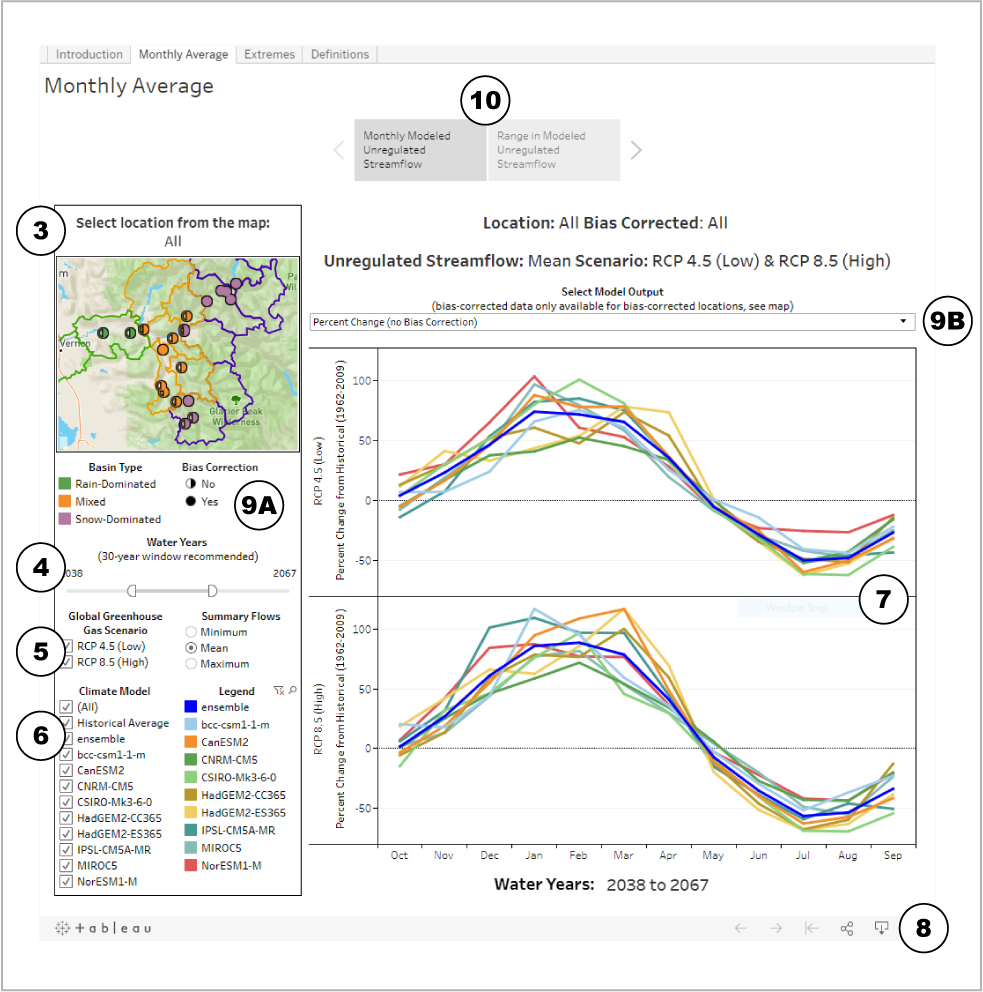
Start with selecting the Monthly Average visualization tab on the introduction page. When it launches it will automatically bring you to the Modeled Unregulated Monthly Streamflow page. From here it is possible to:

- Select a location by clicking a circle in the map

- Change the range of water years

- Select greenhouse gas scenario(s) and summary flows

- Select climate model(s)

The data will be visualized on the right side. Note that the visualization averages multiple locations when multiple locations are selected.

It is also easy to download the information for presentations or papers or share it with others.

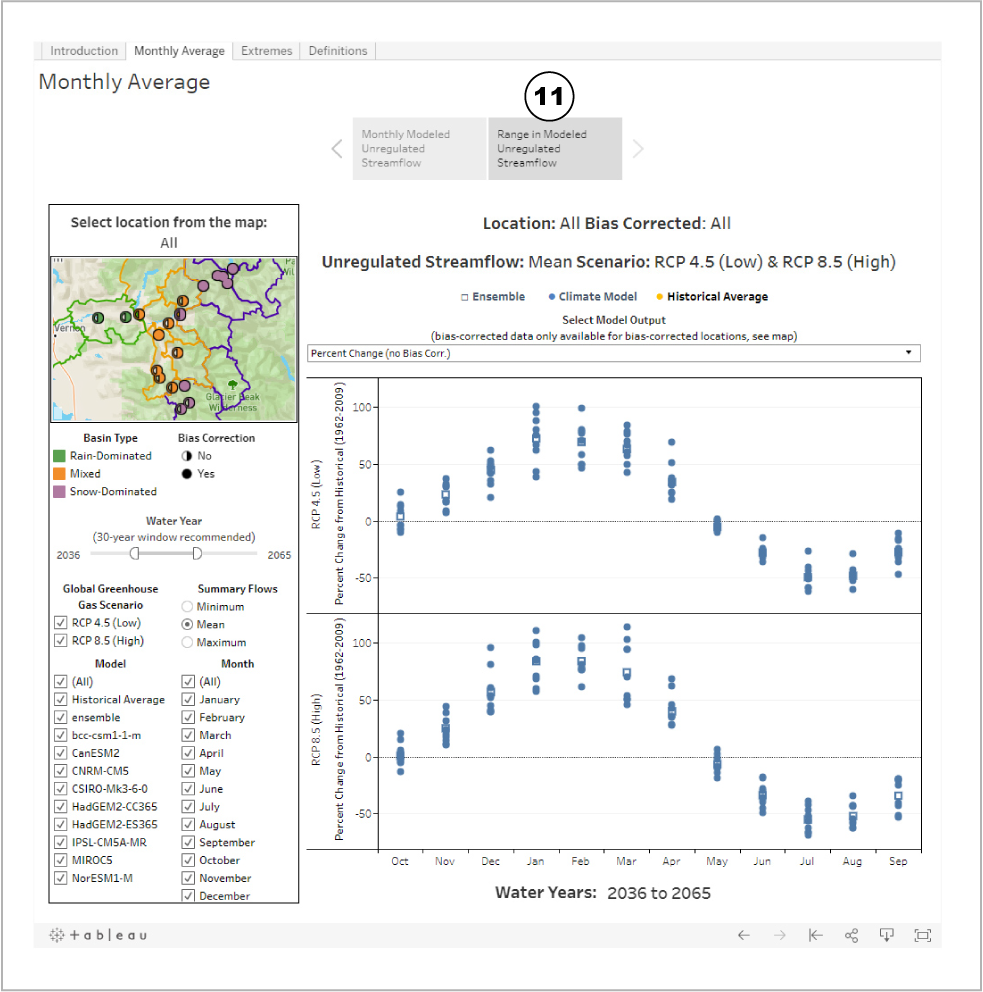
IMPORTANT: In all visualizations within the Monthly Average tab (both Modeled Monthly Unregulated Streamflow and Range in Modeled Unregulated Streamflow) it is important to note if the data from the selected location is bias corrected or not.

If the selected location is not biased corrected, then it will not be possible to view bias corrected data in the Model Output drop down.If the user selects a bias corrected option for a non-bias corrected location then the data visualization will appear blank.

Within the Monthly Average visualization, it is possible to look at both Monthly Modeled Unregulated Monthly Streamflow and the Range in Modeled Unregulated Streamflows. The visualization below is for the Modeled Monthly Unregulated Streamflow.

Within the Monthly Average visualization, but now selecting for the Range in Modeled Unregulated Streamflows, which shows the same data in a scatter plot versus a line graph. It will still be possible to select a location and set the other options as noted above.