
Natural Variability
In any time period (seasons to decades), natural variations in ocean temperatures, winds, and other factors can cause the climate to deviate from what is considered typical. Two important phenomena affecting the Pacific Northwest—the El Niño Southern Oscillation (ENSO) and the Pacific Decadal Oscillation (PDO)—are caused by naturally changing patterns in ocean circulation (Figure 1). These natural phenomena create cyclical patterns of climate variability. ENSO has a warm phase (El Niño) and cold phase (La Niña), and lasts 6 to 18 months. PDO is similar, but phases last 20 to 30 years (Figure 2).
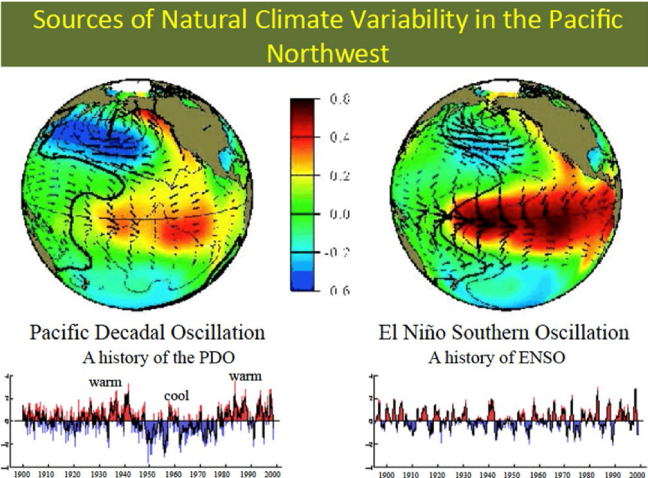
Figure 1. . Sea surface temperatures patterns for warm phase PDO (left) and ENSO (right), with a time series showing periods of warmer (red) and cooler (blue) phases over the 20th century. Source: Climate Impacts Group, University of Washington.
Climate Change
The overall consensus among climate scientists worldwide is that the Earth’s climate has changed substantially over the last century and will continue to change in the coming decades as a result of increasing emissions of heat-trapping gases from human activities. These “greenhouse gases” include carbon dioxide, methane, and nitrous oxide, and as their concentrations increase in the atmosphere, global temperatures rise.
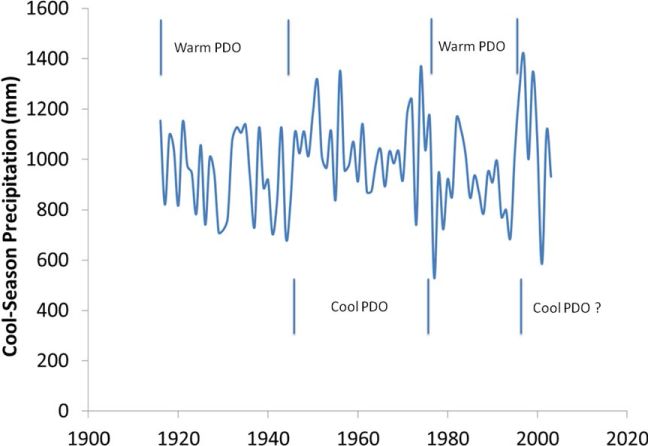
Figure 2. Cool-Season (Oct-March) precipitation averaged over the WA and OR Cascades with “warm” and “cool” PDO epochs. Warm phases mean warmer, drier winters; and cool phases mean cooler, wetter winters with above average snowpack and streamflow.
Climate Change and Natural Variability
Climate change will express itself as a complex combination of variability plus a trend. The cyclical pattern of natural variability (blue line in Figure 3) is combined with an overall warming trend (red line). What results is a “stairstep” pattern (black line) of rapid rise and plateau. This means, even as global and regional temperature trends increase over time, there will still be colder than average periods and warmer than average periods as natural variability and climate change occur simultaneously.
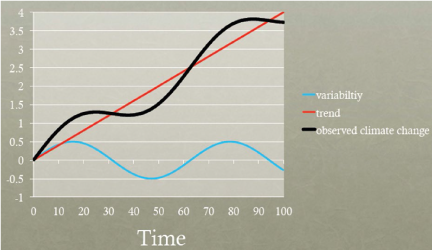
Figure 3. Climate change variability.
For example, from 1959–2011 north Cascades glaciers have had periods of rapid decline as temperatures warm and periods of plateau in cooler years (Figure 4).
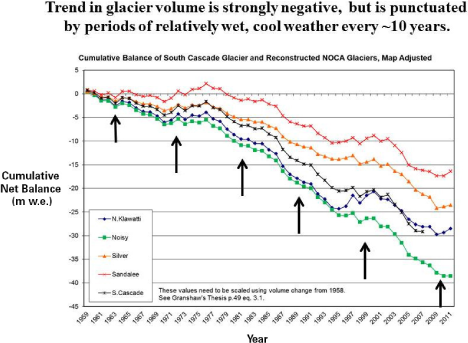
Figure 4. Cumulative changes in mass for five north Cascades glaciers from 1959–2011. Sources: Granshow, 2001; Riedel and Larrabee Figure 1. Observed daily maximum, minimum, and mean temperature at Skagit Regional Airport from July 18–22, 2013. Source: http://weathersource.com
Another example is the winter and spring of 2011, which saw precipitation in the North Cascades at 124% above average (1970–1999) and exceptionally high snowpack throughout the Cascades late into the spring, was a La Niña and a cold phase Pacific Decadal Oscillation year. Neutral phases of both cycles are characterized by average winter conditions.