
Skagit Delta Flood Outlook: Greater Risks Where River Meets Sea
Subsections of this page include:
- Skagit Delta Already Vulnerable to Coastal Flooding
- Rising Sea Levels Increase Vulnerability
- Delta Flood Risk Includes Groundwater Flooding
- Rising Sea Levels Increase Fresh Groundwater Levels
- Climate Change Increases Skagit Delta Flood Risks
- Coastal Conditions that Increase Flood Risks
- Sinking Shorelines
- Storm Events
- Rising Sea Levels
- Connecting Sea Level Rise with Consequences for Coastal Flooding
Skagit Delta Already Vulnerable to Coastal Flooding
Lowland areas in the Skagit Delta are vulnerable to coastal flooding in addition to river flooding because they reside below the average high tide level of Puget Sound (Figure 1). Dike structures shown in red keep high tide waters from flooding the area.
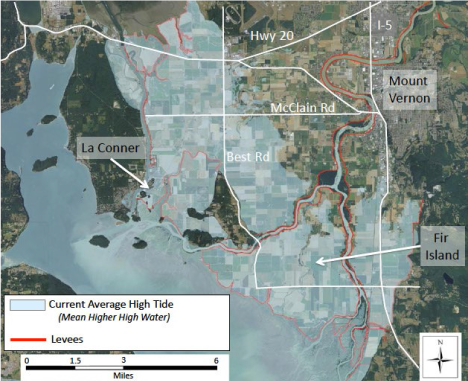
Figure 1: Current extent of high tide if there were no dikes.
Lowland areas in the Skagit Delta are vulnerable to coastal flooding in addition to river flooding because they reside below the average high tide level of Puget Sound (Figure 1). Dike structures shown in red keep high tide waters from flooding the area.
Rising Sea Levels Increase Vulnerability
New data and refined models of projected sea level inundation, provide insight to likely changes in flooding, ponding and drainage. For example, if we add sea level rise for the year 2100 to the current level of Highest Observed Water (HOW), the tide would overtop the present levee configuration, flooding the low areas (Figure 2). Red areas are flooded up to 3.3 feet, yellow to 6.5, light green to 9.8, and light blue areas to 13 feet of water during a high tide event.
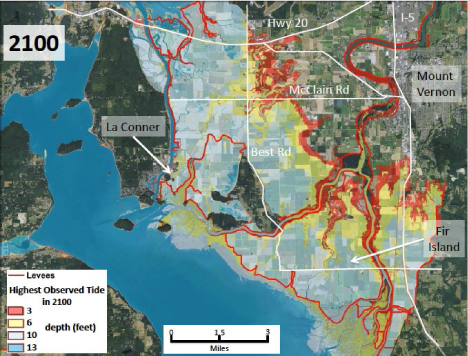
Figure 2: Future projected extent and depth of an extreme high tide with the current dike system.
Delta Flood Risk Includes Groundwater Flooding
The level of Puget Sound, regular tidal variation, precipitation and river flows currently affect groundwater levels, ponding and drainage (Figures 3 and 4).
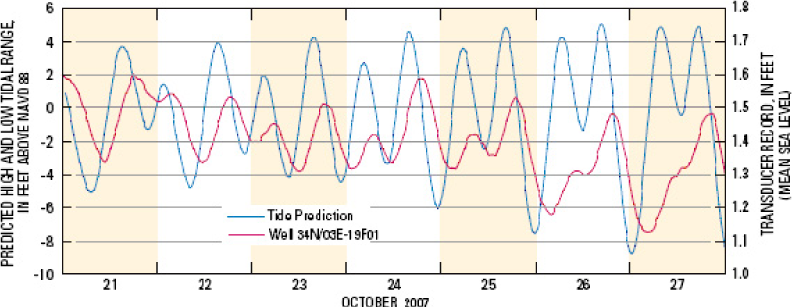
Figure 3. Tidal pumping at Skagit well. Increases in tides also increase fresh groundwater levels, as shown by the effect of tidal height (blue) on groundwater well levels (red) located more than half a mile from the shoreline in the Skagit delta. Source: Savoca et al, 2009.
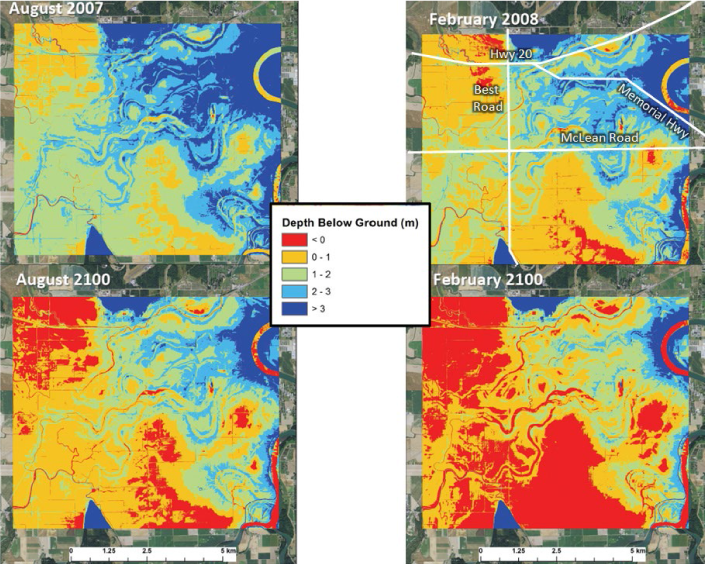
Figure 4. Areas in red depict where fresh groundwater surfaces.
Rising Sea Levels Increase Fresh Groundwater Levels
Rising groundwater levels increase areas of surface ponding and create challenges for gravity-fed drainage systems on the delta. Figure 4 displays a model of the projected change in depth of fresh groundwater below the land surface in the Skagit delta from August 2007 and February 2008 to the same months in 2100 given a climate change scenario of a 1.0 meter rise in sea level.
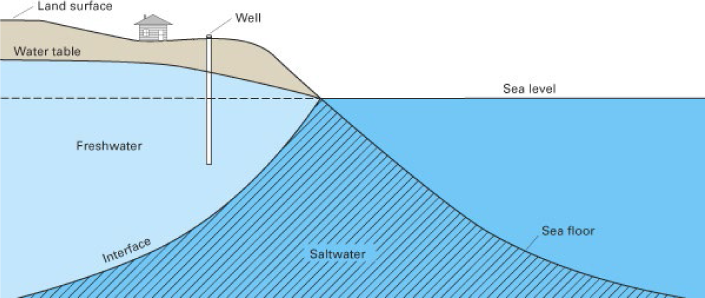
Figure 5. In coastal areas increasing sea levels (tidal or climate-related) push fresh groundwater closer to the surface and may also make it brackish.
Climate Change Increases Skagit Delta Flood Risks
The Skagit delta, from below Mt. Vernon to Puget Sound, is where the river is heavily influenced by the tide. The most dangerous floods occur in the delta and upstream when both the river and Puget Sound are high at the same time. Coastal storms and low pressure events increase local sea levels, and when they occur at the same time as a river flood, can substantially increase flood damage. Figure 3 shows the impacts of an extreme flood (100-yr flood event) accompanied by a storm surge of 1.5 feet.
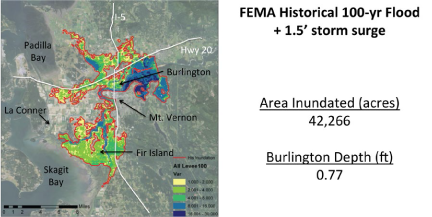
Figure 6. Modeled impacts for an extreme flood, assumes flooding is due only to overtopping of levees. Red outline: flooded area. Blue shading: deeper water. Source: Hamman et. al (in preparation).
Climate change is projected to increase both river flood volume and sea level, which will amplify the delta flood impacts. Figure 4 looks at impact from the flood event shown in Figure 3, but with future projected increased peak flows and sea levels. Note that the rates for expected sea level rise used in this hydrological model are on the high end of rates projected for climate change by 2080.
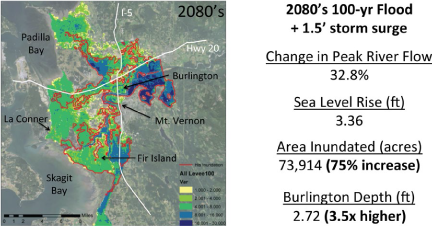
Figure 7: Modeled impacts for an extreme flood under future sea level and peak flow conditions, assumes flooding is due only to overtopping of levees. Red outline: flooded area shown in Figure 6.
Coastal Conditions that Increase Flood Risks
Sinking Shorelines
Sea level rise is relatively greater in the Skagit area than near the Olympic Peninsula because much of Puget Sound is subsiding, or sinking (Figure 1). Scientists believe the Skagit Delta is sinking between 0 to 1 mm per year as a result of deep subsidence, due to shifting in tectonic plates. Since the regional sea level rise estimates assume 1mm/yr of uplift on average across the whole region, a local subsidence rate of 1mm/yr in the Skagit area may shift the range of sea level rise projections upwards by up to 8 inches or more by 2100 for the Skagit area. River deltas with levees also experience shallow subsidence due to soil compaction, decomposition, erosion, and loss of sediment. As these areas sink, they become more vulnerable to flooding from rising groundwater, another consequence of sea level rise.
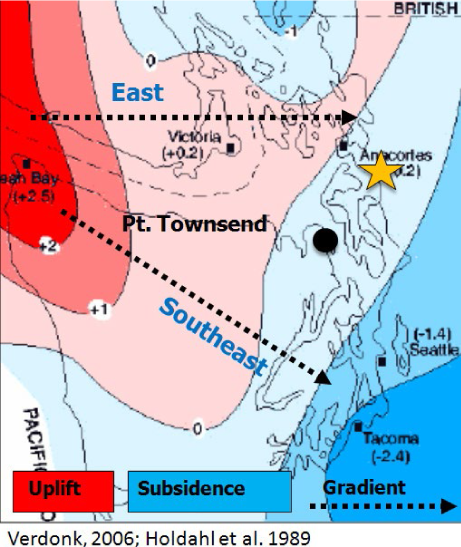
Figure 1. In Puget Sound, the Olympic Peninsula shorelines are rising (“uplift” in red) whereas the Skagit delta shorelines are sinking (“subsidence” in blue.)
Storm Events
Storm surges are caused by wind, waves and changes in barometric pressure often generated during late fall and winter storms. For instance, in Skagit Bay, waves can reach 3–5 feet tall on top of the regular tidal cycle (Figures 2 & 3). On average, higher than predicted tides are experienced nearly 50 days each year as a result of weather. Further contributing to coastal flood risk, the highest tides of the year coincide with the seasons of strongest storms and the biggest river floods. As the normal height of the Puget Sound rises, coastal flooding in the Skagit area will become more destructive. In addition, scientists are watching stations for changes in wind speed, as early evidence suggests peak wind speeds may be increasing, which would also exacerbate flood damage.
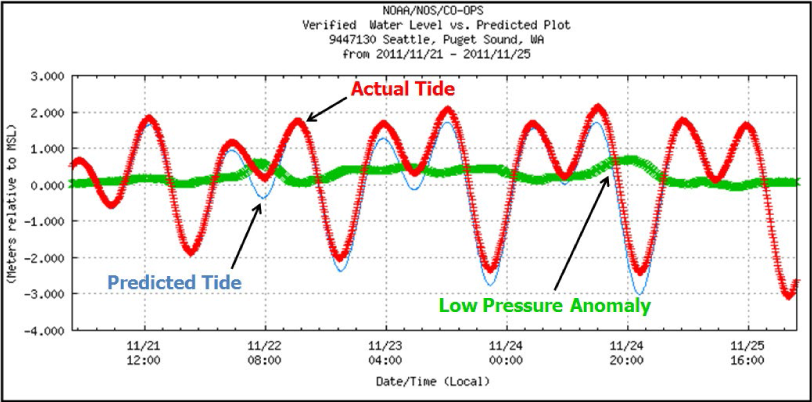
Figure 2. Low pressure elevates the sea surface 1.9 cm for every 1 mb of pressure. The difference between the predicted tide level and the actual tide in this figure is the tidal surge created by a low pressure system.
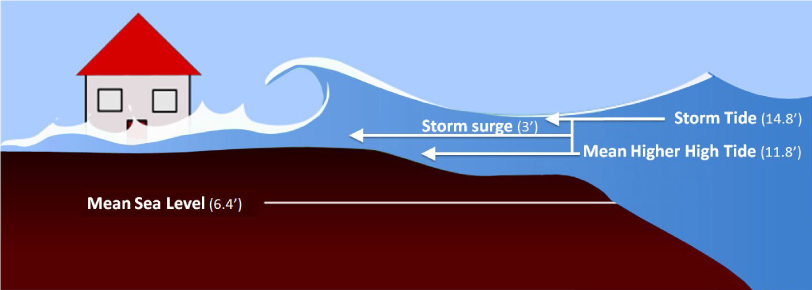
Figure 3. A storm surge temporarily raises sea level several feet.
Rising Sea Levels
Sea level have risen in parts of Puget Sound such as Seattle (Figure 4) and are projected to continue to rise (Figure 5). Sea levels in Skagit Bay are not currently being measured and this rpresents a significant data gap.
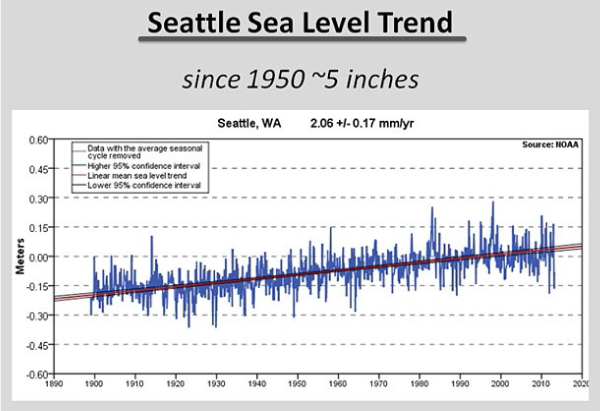
Figure 4. Sea level in Seattle has risen by about 9.8 inches since 1900. Sea levels change based on a variety of factors.
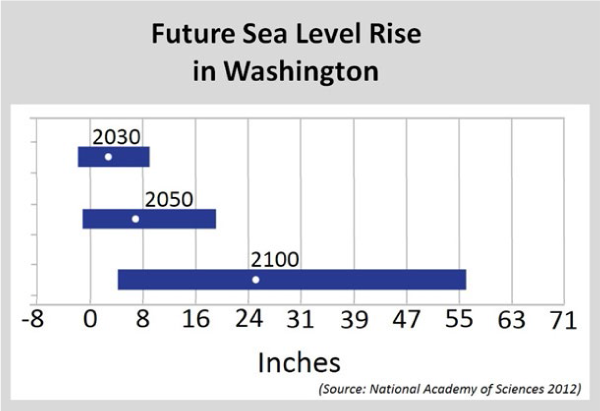
Figure 5. The white dots represent the projected sea level while the blue bars represent the range of variability resulting from individual factors that contribute to sea level rise.
Connecting Sea Level Rise with Consequences for Coastal Flooding
Changes in the base sea level magnify the size of a storm surge (Figure 5). For example, a 100-year coastal storm event turns into a 10-year storm event when sea levels rise by 12 inches, and an annual event when sea levels rise by 24 inches. This range of sea level increase is projected for Puget Sound by 2100.
More information is available in the recent Northwest Science Special Issue article “Combined Effects of Projected Sea Level Rise, Storm Surge, and Peak River Flows on Water Levels in the Skagit Floodplain.”